Download
1 / 21
630 likes | 1.71k Vues
Statistical Quality Control (SQC). Why control the process? Products and services require uniform quality. Process variation is inevitable reduce variation for better quality (conformance to specs). Some Generic Tools for QC. Process flow chart Pareto analysis Run chart Histogram

E N D
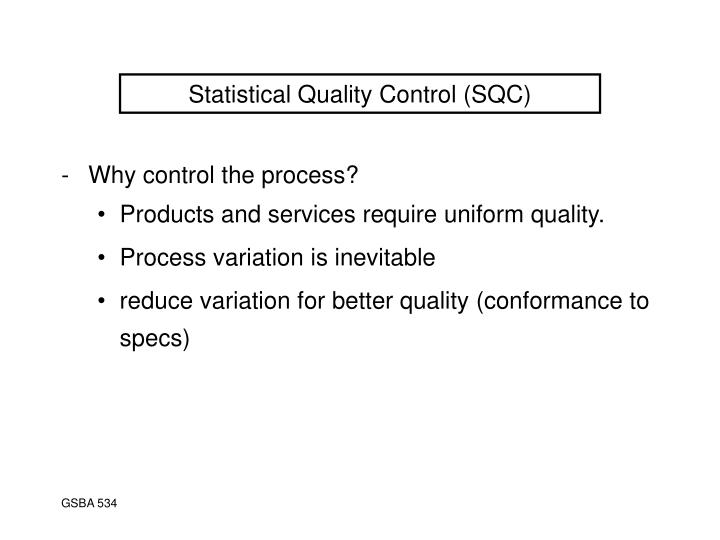
Statistical Quality Control (SQC) • Why control the process? • Products and services require uniform quality. • Process variation is inevitable • reduce variation for better quality (conformance to specs)
Some Generic Tools for QC • Process flow chart • Pareto analysis • Run chart • Histogram • Checksheet • Causes and effect diagram (Fishbone diagram) • Control charts
SQC • Sources of variation in process: • random variations (can not be controlled) • non-random variations (can be controlled) • What should we do? • We can not eliminate the variation, but we can identify the sources of non-random variations and hence improve the process.
Statistical Sampling • Identify the problems • 100% inspection • sampling • DO NOT TEMPER WITH THE SYSTEM!!! • Sample measurement: • variable (continuous): such as weight, length, …. • Attribute (good, no-good) • defectives: the acceptability of products across a range of characteristics • defects: a product that has at least one defective
Control Charts • Purpose: • Using the samples collected from the process, and calculating the required statistics to construct a time sequence chart to detect the process variation. • Process control with variablemeasurements: • For each sample, we measure the weight, volume, length, or other variable measurements. • Process control charts (variable measures): • X-bar chart • R chart
Control Charts (variable measures) • The sample mean follows a normal distribution. • If the process does not change over time, every sample mean should follow the same normal distribution. • X-bar chart: • A plot of the sample means taken from the process. It is used to detect the change of the process mean (mean for the normal distribution). • R chart: • A plot of the sample variation range. It is used to detect the change of process variation (variance for the normal distribution).
X-bar and R charts • Change of process mean • Change of variance
Developing Control Charts 1. For each sample, - calculate the sample mean. (n is the number of observations in a sample (sample size)) - calculate the range. 2. For all the samples, - calculate the overall mean. - calculate the average range. (k is the number of samples)
Developing Control Charts (continued) 3. For the X-bar chart: - Upper control limit (UCL)= - center line = - Lower control limit (LCL)= 4 For the R chart: - Upper control limit (UCL)= - center line = - Lower control limit (LCL)= 5. Look for A2, D3, D4 in Exh. S5.4.
Control Charts-Example The following measures of shaft diameters were taken from a company producing transmission boxes. Construct the X-bar and R charts. sample diameter (in inches) 1 2.10 2.08 1.97 2 1.99 1.98 2.05 3 2.00 2.01 1.98 4 2.09 2.10 2.05
Example (continued) • X-bar chart • R chart
Example (continued) Two new measures were taken this week. Using the control charts developed, explain your findings. sample diameter (in inches) 1 2.31 1.86 1.91 2 1.86 1.85 1.79
Interpreting the Control Charts • X-bar and R charts MUST BE USED TOGETHER!! sample measurements 1 10.0 10.1 10.2 2 13.0 9.5 7.8 - sample 1 and 2 have the same mean (10.1) - sample 2 has greater variation than sample 1. (R1=0.2, R2=5.2) sample measurements 1 10.0 10.1 10.2 2 13.0 13.1 13.2 - sample 1 and 2 have the same variation (0.2) - sample 2 has a higher mean than sample 1. • See Exh. S5.3.
Control Chart for attribute measures: p chart • Sample units are only classified into one of two categories (good or bad, success or failure, etc.)
P Chart-Example A visual inspection for scratches produced the following data for last week. For each sample, 30 units were inspected. Sample # of defects sample # of defects 1 5 6 4 2 4 7 5 3 4 8 6 4 5 9 4 5 7 10 5
Example (continued) This week 30 units were inspected on each of 2 occasions. On Monday, 6 units were found defective. On Tuesday, 9 were found defective. Is this process in or out of control?
Process Capability • Control charts are of little value if the process is not capable of making products within design specification (or tolerance) limits. • Process capability = 6 s (s: standard deviation of the process) • Process capability ratio = Upper tolerance limit (UTL) - Lower tolerance limit (LTL) 6s - higher ratio: the process is potentially more capable of making the product within the design specification.
Process Capacity vs. Design Specs (Tolerance) • process variability matches specs • process variability well within specs • process variability exceeds specs
Capability Index (Cpk) • Indicates how well the process performs relative to the target value. • Cpk is used to determine whether the process mean is closer to the UTL or LTL.
Process Capability-Example A metal fabricator produces connecting rods with an outer diameter that has a specification of 1.000 +/- 0.010 inch. The process mean is determined to be 1.002 inches with a standard deviation of 0.003 inches. What do you think about the process?