Download
1 / 23
240 likes | 507 Vues
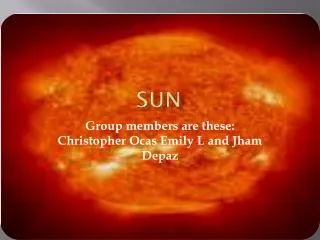
Solar mass: 1.98x10 33 gm. SUN. Solar radius: 6.96x10 10 cm. Quiescent Solar luminosity: 3.83x10 33 ergs/s. Mean Solar density: 1.410 gm cm -3. Earth-Sun distance: (1 AU): 1.5x10 13 cm. Visual magnitude of the Sun: -26.73. Solar constant: 0.1353 Watts cm -2.

E N D
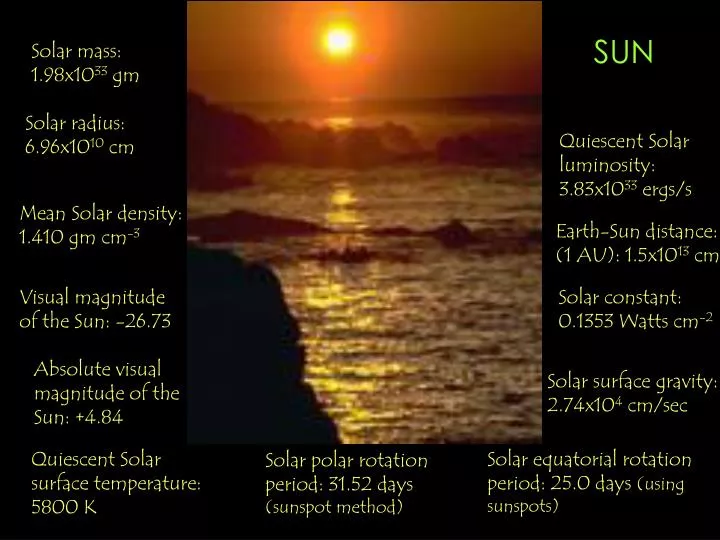
Solar mass: 1.98x1033 gm SUN Solar radius: 6.96x1010 cm Quiescent Solar luminosity: 3.83x1033 ergs/s Mean Solar density: 1.410 gm cm-3 Earth-Sun distance: (1 AU): 1.5x1013 cm Visual magnitude of the Sun: -26.73 Solar constant: 0.1353 Watts cm-2 Absolute visual magnitude of the Sun: +4.84 Solar surface gravity: 2.74x104 cm/sec Quiescent Solar surface temperature: 5800 K Solar equatorial rotation period: 25.0 days (using sunspots) Solar polar rotation period: 31.52 days (sunspot method)
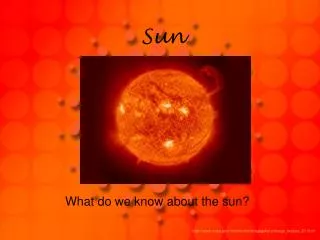
Sun, MLSO,Ha Ha (6562.8 ) images from the High Altitude Mauna Loa Solar Observatory (012199) Haemission is recombination radiation from hot gas in the photosphere. In the chromosphere, H atoms are heated by thermal conduction and excited by collision. During Solar flares, H is exicted by beamed electrons .
Sun, KPNO, He I He I 10830 spectroheliograms from the U.S. National Solar Observatory at Kitt Peak AZ (070299) Early observations of He I emission, coupled with its high ionization energy (~20 eV), revealed temperatures at the chromosphere and corona much hotter than at the photosphere. The He lines are much weaker in coronal holes and are enhanced in active regions. Note the remarkable limb brightening.
Sun, USNSO Ca II K 8542 spectro-heliograms from the U.S. National Solar Observatory at Sacramento Peak NM (060199) The Ca II resonance spectral line serves as a diagnostic for plasma properties, activity levels and magnetic influence of the Solar chromosphere. The differential emissivity provides a Dopplergram of Solar rotation.
Sun, KPNO, Ca II Ca II 8542 magnetograms from the U.S. National Solar Observatory at Kitt Peak, AZ (070299) Ca II magnetograms reveal clumps of magnetic structure that diagnose convective motions which transport energy from the Solar interior.
Sun, KPNO,magnetogram Photospheric magnetograms from the U.S. National Solar Observatory at Kitt Peak AZ (070299) Standard photospheric magnetogramsat 6303 trace the magnetic field orientation at the surface of the Sun. Together with observations of bright points, plumes, and active regions, one obtains a picture of the turbulent mhd activity occuring at the Solar surface due to the emergence of Solar flux tubes.
Sun, MLSO,Coronameter White-light coronameter images from the High Altitude Observatory Mauna Loa Solar Observatory (022399) White light (integrated Solar emission between 4000 and 7000 ) coronameter images reveal activity of the corona
Sun, LASCO SUMER, He I He I 584.3 emission line observed with SUMER on 2-4 March 1996 Sun observed in He I, formed in the upper chromosphere at about 20,000 K. The picture was put together from eight horizontal raster scans in alternating directions, starting in the solar NE. Each raster scan includes 1600 exposures, lasting 7 seconds each. The picture is shown in bins of 4x4 pixels, one pixel being ~ 1 arcsec.
Sun, SOHO EIT, He II He II emission in the extreme UV is formed by excitation and ionization of He by energetic beamed electrons produced in the low chromosphere. The formation of electron beams may be due to magnetic reconnection in flare loops emerging from the active regions at the Solar surface. Full-field HeII 304 image (070299)
Sun, SOHO EIT , Fe XV Full-field Fe XV 284 image (070299) Fe XII-XVIII Full- disk images in FeXII 195 and FeXV 284 allow study of the properties of the quiet corona outside and inside coronal holes.
Sun, Soho EIT , Fe XII Full-field Fe XII 195 images (070299) Fe XII-XVIII emission is formed in the low corona (2x10⁶ K) of the Sun and is due to recombination of elecrons with ionized Fe.
Sun, SOHO EIT, Fe IX Full-field Fe IX, X 171 images (070299) Full Sun EUVimages in FeIX-X 171 show the latitude-time distribution of the X-ray bright points and their relation to the structures inside coronal holes.
Sun, Yohkoh Yohkoh soft X-ray telescope (SXT) full-field images from the Hiraiso Solar Terrestrial Research Center (040299) Solar soft X-rays come primarily from thermal and nonthermal continuum electron bremsstrahlung and X-ray lines due to the excitation of inner shells of ions
YohkohSatellite Yohkoh (``Sunbeam'' in Japanese) is a satellite dedicated to high-energy observations of the Sun, specifically of flares and other coronal disturbances. The Yohkoh mission was launched on August 30, 1991, from the Kagoshima Space Centre in southern Japan. The spacecraft carries a payload of four scientific instruments: the Soft X-ray Telescope (SXT), the Hard X-ray Telescope (HXT), the Bragg Crystal Spectrometer (BCS) and the Wide Band Spectrometer (WBS). The SXT (which is sensitive in the range 1-2 KeV) takes images in various wavebands (selected by filters) using a CCD - either the full CCD frame, or a selected part of the CCD frame is returned in telemetry - these are known as full frame, and partial frame images (FFI and PFI); the HXT (which is sensitive in the range 10-100 KeV) measures Fourier components in 4 channels through a set of 64 pairs of grids - the images are reconstructed on the ground; the BCS observes the line complexes of Fe XXVI, Fe XXV, Ca XIX and S XV using bent germanium crystals; and the WBS observes the overall energy release between soft X-rays and gamma-rays using three separate instrument packages.
The solar interior • GOLF and VIRGO will perform long and uninterrupted series of oscillations measurements of the full solar disk, respectively in velocity and in the irradiance domain. In this way, information will be obtained about the solar nucleus. SOI/MDI will measure oscillations on the surface of the Sun with high angular resolution. This will permit to obtain precise information about the Sun's convection zone - the outer layer of the solar interior. • The solar atmosphere • SUMER, CDS, EIT, UVCS, and LASCO constitute a combination of telescopes, spectrometers and coronagraphs that will observe the hot atmosphere of the Sun, the corona, extending far above the visible surface. SUMER, CDS and EIT will observe the inner corona. UVCS and LASCO will observe both inner and outer corona. They will obtain measurements of the temperature, density, composition and velocity in the corona, and will follow the evolution of the structures with high resolution. • The solar wind • CELIAS, COSTEP and ERNE will analyze in situ the charge state and isotopic composition of ions in the solar wind, and the charge and isotopic composition of energetic particles generated by the Sun. SWAN will make maps of the hydrogen density in the heliosphere from ten solar diameters. It uses telescopes sensitive to a particular wavelength of hydrogen, allowing the large-scale structure of the solar wind streams to be measured. SOHO Satellite
National Solar Observatory on Kitt Peak The National Solar Observatory (NSO) is part of the National Optical Astronomy Observatories (NOAO) which was formed in 1984. NSO operates two major observatory sites. On Sacramento Peak in southern New Mexico (picture shown above left), major telescopes include the Vacuum Tower Telescope, the John W. Evans Solar Facility, and the Hilltop Dome. Sacramento Peak has been a center of solar research since 1950; the observatory is a cooperative undertaking of NSO and the Air Force Phillips Laboratory. On Kitt Peak, outside of Tucson, Arizona, NSO operates the McMath-Pierce Solar Facility and the vacuum solar telescope.
Mauna Loa Solar Observatory The Mauna Loa Solar Observatory (MLSO) operates daily, weather permitting. Data collected by instruments at the site are: Ha disk and limb images, collected with the digital prominence monitor. Coronal images in white light polarization brightness, collected with the Mark 3 K-coronameter. Solar oscillation data collected with the Low Degree instrument. Helium I images, collected with the Chromospheric Helium I Imaging Photometer
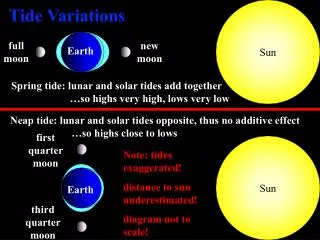
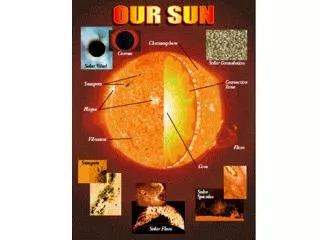
Solar Atmosphere The photosphere, shown as an orange vertical line, is the region where sunspots are formed. The less dense and turbulent chromosphere is a rapidly-changing filamentary structure that is seen during eclipses as a bright red ring around the Sun. The intensely active transition region, illustrated by the vertical yellow line, was first observed in detail by Skylab in the late 1970s. Spicules extend the chromosphere into the corona as pointed waves. Prominences and the corona reach far into interplanetary space.
Figure shows two scans of the solar spectrum in the region of the sodium Fraunhofer D lines at 5890 and 5896 . Several of the weaker features are due to water vapor in the earth's atmosphere, and show different strengths in these two scans because of the difference in humidity on the two days on which the scans were made. Photosphere The Solar photosphereisthe region that is optically thick to visual continuum light; thus it is the lowest portion of the Solar atmosphere that can be observed with optical telescopes. Solar spectra show continua and emission and absorption lines. In the visible region, however, the sun shows an absorption line spectrum superimposed on a quasi-blackbody continuum formed in the solar interior. The absorption lines are formed as the continuum radiation passes through the cooler outer layers of the sun and through the earth's atmosphere. Each line corresponds to one (or more, in the case of several close, blended features) absorption line. Physical parameters of interest include temperature, pressure, abundances of various elements and compounds, magnetic field strength, and bulk velocity distribution.
Corona The Solar corona is the outermost layer of the solar atmosphere, characterized by low densities (<109cm-3) and high temperatures (> 106 K) that extends to several solar radii. The shape of the corona is different at solar maximum and solar minimum. The heating of the corona has been a long-standing mystery. Image shown is from the LASCO experiment on SOHO.
Chromosphere The Solar chromosphereis the ~2000 km thick layer of the solar atmosphere above the (temperature-minimum) transition region and below thecorona. Being transparent in the continuum, it is seen during eclipses as a bright red ring around the Sun. Energy is transported by radiative diffusion through the chromosphere, which reveals itself most strongly in the light of Ha and CaII K. Views of the chromosphere show convective cell patterns similar to those in the photosphere, but much larger. This large scale convection is known as super-granulation.
Coronal Holes and Active Regions This image at left from Yohkoh shows the Solar corona. The bright features represents magnetically-trapped plasma. In contrast, the dark regions, known as coronal holes, are where the Sun's magnetic field extends out into space, allowing the hot gas to escape. These regions contain material which is cooler than the surrounding ~106 K plasma seen in soft X-rays, and often appear near the Sun's poles as seen above. Active regions are formed when magnetic field lines of the Sun emerge from the photosphere and open into the corona. Hot gas is visible near the magnetic field, making bright loops. Active regions may last for several weeks or even several months. Sunspots (image at right) are often associated with active regions, as seen above.
Solar Magnetograms Magnetograms are maps of the line-of-sight component of magnetic flux at the photosphere, the sun's visible surface. The fields are measured by detecting the Zeeman shift between right-hand and left-hand circularly polarized light in a suitable magnetically sensitive absorption line. Only the line-of-sight component can be measured this way. Upper left: 10 Ca K line; upper right is corresponding magnetogram. Light and dark areas in image at left show where the field is large and directed out of and into the Sun, respectively.