Download
1 / 17
170 likes | 277 Vues
Screening Deficit Irrigation Strategies Using Crop Growth Simulation R. Louis Baumhardt and Scott A. Staggenborg USDA- ARS Conservation and Production Res. Lab. Bushland , TX Kansas State University Plant Science Center, Manhattan, KS. Depth to Water. Depth to Water.

E N D
Screening Deficit Irrigation Strategies Using Crop Growth Simulation R. Louis Baumhardt and Scott A. Staggenborg USDA-ARS Conservation and Production Res. Lab. Bushland, TX Kansas State University Plant Science Center, Manhattan, KS
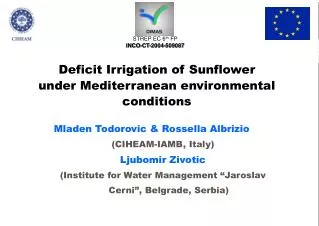
Depth to Water Depth to Water Irrigation Well No. 2 - Bushland, TX Irrigation Well No. 2 - Bushland, TX 0 0 -50 -50 1957-77 1957-77 -100 -100 65 ft Decline 65 ft Decline -150 -150 1977-98 1977-98 21 ft Decline Depth Below Ground - ft -200 21 ft Decline Depth Below Ground - ft -200 -250 -250 Red Bed Red Bed -300 -300 (aquifer bottom) (aquifer bottom) -350 -350 1955 1965 1975 1985 1995 2005 1955 1965 1975 1985 1995 2005 Year Year • Well capacity has declined with the decreasing water table. • The choice is between deficit irrigation or concentrating water to adequately irrigate a portion.
Irrigation-strategy Question: • Will uniformly spreading water resources to deficit irrigate a large area produce more or less crop yield than if that same water resource was concentrated to irrigate a smaller area and averaged with the complementary dryland area? Uniformly Irrigate Variably Irrigate
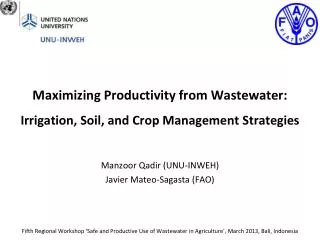
APPROACH • Use crop growth simulators (SORKAM and GOSSYM) and recorded weather at Bushland from 1958-1999 to calculate sorghum grain and cotton lint yields for several deficit irrigation combinations. • Determine crop growth and yield response to deficit irrigation levels for various planting practices or cultivar maturity.
IRRIGATION PARAMETERS • Irrigation – 7 d application interval and 4 capacity levels: • No – Irrigation = Rain only • Irrigation + Rain = 2.5 mm d-1 (2 gpm/ac) • Irrigation + Rain = 3.75 mm d-1 (3 gpm/ac) • Irrigation + Rain = 5.0 mm d-1 (4 gpm/ac)
OTHER FACTORS • Sorghum: • Cultivar Maturity = Early (15-leaf), Medium (17-leaf), Late (19-leaf) • PlantingDate = 15 May, 5 June, 25 June • Cotton: • Irrigation Duration = 4 and 8 weeks
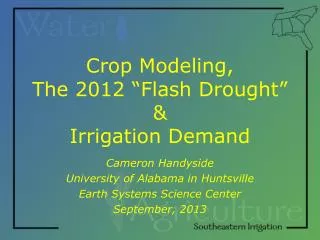
MODEL VALIDATION 7000 SIMULATED = 390 + 0.95*MEASURED r2 = 0.70 6000 RMSE = 903.5 kg ha -1 5000 4000 Simulated Grain Yield, kg ha-1 3000 2000 1:1 1000 0 0 1000 2000 3000 4000 5000 6000 7000 Measured Grain Yield, kg ha-1
1:1 Dryland 5.0 mmd-1 2:1 3.75 mmd-1 Dryland UNIFORM 2.5 mmd-1
1:1 Dryland 5.0 mmd-1 2:1 3.75 mmd-1 Dryland UNIFORM 2.5 mmd-1
SUMMARY • Simulated grain yield increased with increasing irrigation, but simulations also reflect generally better WUE at 3.75 mm d-1 than at 5.0 mm d-1 irrigation levels. • The weighted average grain yield for variable irrigation strategies with a dryland component increased net grain yield from 13% to >20% over uniformly irrigated sorghum.
CONCLUSION • For declining water resources, converting uniform deficit irrigation (water spreading) of a determinate crop like grain sorghum to variable irrigation that concentrates water on smaller areas with a complementary dryland area will increase overall sorghum grain yield.
4 - Week irrigation 8 - Week irrigation Weighted Percent Weighted Percent Irrigation Irrigation Averag e of Base Average of Base Strategy Capacity Yield Yield Yield Yield Yield Yield ____ ____ ____ ____ mm/d % % kg/ha kg/ha UNIFORM 2.5 390 390 87 450 450 100 2:1 3.75 530 425 94 615 480 106 Dryland 220 220 1:1 5.0 660 440 98 7 20 470 104 Dryland 220 220 1:1 Dryland 5.0mm/d 2:1 3.75mm/d Dryland UNIFORM 2.5 mm/d SIMULATED COTTON YIELD vs IRRIGATION STRATEGIES
CONCLUSION • Cotton yield levels are maintained or increased by converting from uniform deficit irrigation (water spreading) to variable irrigation on part of a field (concentrating water) with a complementary dryland area.
} YEAR = 3 YEAR = 1 } 2.5” 2.0” WHEAT 1.5” O S A N D 1.0” J J J F M FALLOW 0.5” A M 0.0” Rain A M F M J J SORGHUM D J N A O S } FALLOW O S A N YEAR = 2 J D J J F M A M Wheat-Sorghum-Fallow Rotation • Two crops in three years, • Storage of precipitation as soil water, • Stable grain crop yields
35 11’ N, 102 5’ WElevation = 1170 mGrowing season = 181 d 2500 Pan-Evaporation 2000 Precipitation 1500 WATER DEPTH, mm 1000 500 0 Jan Feb Mar Apr May Jun Jul Aug Sep Oct Nov Dec MONTH