Download
1 / 10
100 likes | 105 Vues
Offense of Network Level Footprints of Facebook Applications. By Aaron Ballew, Zhen Qin. User-perceived delay. Three main components: the geographical distribution of users and their access speeds processing speed and overhead of OSNs bandwidth and processing speed of application servers

E N D
Offense of Network Level Footprints of Facebook Applications By Aaron Ballew, Zhen Qin
User-perceived delay Three main components: • the geographical distribution of users and their access speeds • processing speed and overhead of OSNs • bandwidth and processing speed of application servers This work mainly works on the last two components and neglect the first one.
Applications selected representative? • Only select six applications • Experiments in the paper just use part of them
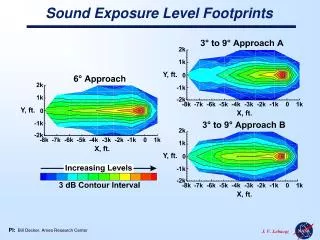
Uncertain factors in methodology Four time stamp in methodology (Figure 2): • t1: request departure time stamp at client • t4: arrival time stamp at application server • t6: departure time stamp at application server • t9: request arrival time stamp at client Propagation delays are uncertain factors
Server Request Processing Delay • Figure 7 and Figure 8 says load impact the processing delay, but they are just the delays of two specific applications. Representative? • These delays have different characters: delay in Figure 7 varies obviously with the load while delay in Figure 8 not. The paper explain the reason as sever update… So, different servers have different delays… Does this result make sense?
OSN Server Response Processing Delay • It is just a piece of total time user request to third-party applications.
Overview of the delays • (t1~t2) Connection Setup Overheads not mentioned • (t3~t4,t6~t7,t8~t9) Network Transmission and Propagation Delays uncertain factors • (t2~t3) OSN Server Request Forwarding Delay negligible (section 6.2) • (t4~t5) Server Request Queuing Delay negligible (section 5) • (t5~t6) Server Request Processing Delay not make sense • (t7~t8) OSN Server Response Processing Delay a piece total delay
Thoughts on Contribution • Let’s assume correctness & novelty are there, what about contribution? It is all obvious, trivial, and not general enough • What is the significance of the # of friends the test users have? Why not the # of friends that have the app installed, isn’t that more important? • Figure 4, diurnal usage. Is this not obvious? Is this different than any normal network traffic? In section 7, “discussion” there is mention that request inter-arrival times were exponentially distributed. This is important! Where is the graph and what causes this behavior? • “targeting app content to time of year plays a role in the growth of apps...” Trivial. This is marketing, not networking. • Preferential attachment stuff is interesting to confirm but also obvious. i.e. popular stuff gets more people interested than unpopular stuff. Can you explain/model this? Are you aware of any research in marketing, etc that already investigates this? • Figure 7, processing delay correlated to high load. Obvious. • Figure 8, after a server upgrade, processing delay went down. Obvious.
Thoughts on Contribution • Top of page 8, “conclude that one does not need exorbitant resources…We acknowledge that processing requirements may differ on a per-app basis.” what is “exorbitant”? That is not a scientific term. And, “may” differ? That is not a claim. That is a wishy-washy supposition, and obviously processing requirements differ for different apps. • Top right, page 8. “nodes farther away geographically have higher round-trip delays…” Obvious. Armenia, India, China register larger delays, but this is dismissed as due to CPU load/power on the PL node. • OSN forwarding delays, go up with request size. Why sample only dec 27 to jan 3? Is this a representative time period? Maybe show a time in the summer too when people aren’t all sitting at home on vacation playing with their computers. • Is this behavior characteristic of OSNs or of Facebook? Maybe a different OSN processes things differenty. Just because Facebook is the standard now, doesn’t mean their way will always be the only way. Basically all of section 6 is very Facebook-specific. Just because you refer to it as “OSN” does not generalize your results. It is “Facebook” results. We see insight about how Facebook processes things, but not necessarily about fundamental OSN behavior. • My favorite one: India gets poor latency, so “allocating data centers closer to far-off regions may improve user experience.” Obvious.
Conclusion • Facebook owes them a free lunch for all this effort. • Maybe their strategy could be applied to other OSNs. • Results were pretty obvious though, and not general at all. • A lot of work and graphs for very little new knowledge.