Download
1 / 29
290 likes | 302 Vues
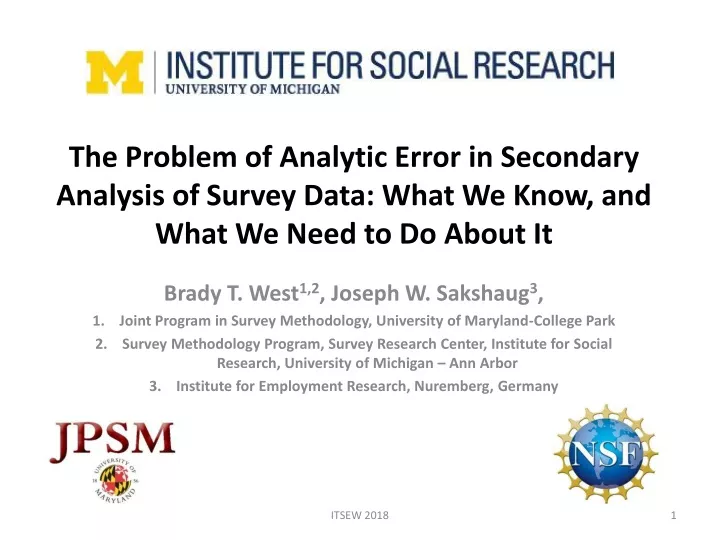
The Problem of Analytic Error in Secondary Analysis of Survey Data: What We Know, and What We Need to Do About It. Brady T. West 1,2 , Joseph W. Sakshaug 3 , Joint Program in Survey Methodology, University of Maryland-College Park

E N D
The Problem of Analytic Error in Secondary Analysis of Survey Data: What We Know, and What We Need to Do About It Brady T. West1,2, Joseph W. Sakshaug3, Joint Program in Survey Methodology, University of Maryland-College Park Survey Methodology Program, Survey Research Center, Institute for Social Research, University of Michigan – Ann Arbor Institute for Employment Research, Nuremberg, Germany ITSEW 2018
Acknowledgements • Financial support for this research was provided by a grant from the National Center for Science and Engineering Statistics (NCSES) of the National Science Foundation (NCSE-1424081) • We also thank past participants in the International Total Survey Error Workshop (ITSEW) and the 2015 International Conference on Total Survey Error (TSE15) for their helpful comments ITSEW 2018
Research Overview • The Total Survey Error (TSE) framework has a rich and varied history of development • Four main error sources have been the primary focus of empirical research related to TSE: • Coverage Error • Nonresponse Error • Measurement Error • Processing Error • Recent studies have started to consider analytic error as a fifth main component (Smith, 2011) ITSEW 2018
Research Overview • If secondary analysts of survey data ignore essential features of complex sample designs in analyses (whether they are design-based or model-based), inferences based on the survey data may well be biased or erroneous: • Weights (for unbiased estimation) • Stratum codes (for increased efficiency of estimates) • Cluster codes (to capture losses in efficiency due to cluster sampling) • A failure to account for these features in secondary analysis will negate the substantial federal resources dedicated to minimizing other sources of TSE for a given survey ITSEW 2018
Past Research on Analytic Error • Smith (2011): An important component of TSE • West et al. (2017, Total Survey Error In Practice): • Review of 100 peer-reviewed journal articles presenting secondary analyses of survey data • Public health focus • A failure to account for weights and complex sampling features in estimation is quite common • Subpopulation analyses in particular are rarely performed correctly in design-based analyses ITSEW 2018
Research Questions • What is the prevalence of “apparent” analytic error in peer-reviewed journal articles, conference presentations, book chapters, and technical reports? • Are there trends across decades in the prevalence of these errors? • Do journal-specific features dictate error rates (e.g., impact factors, having statisticians on editorial boards)? • What are the implications of making these errors for estimation and inference? • Do the same problems exist for establishment surveys? ITSEW 2018
Study Design: NCSES Surveys • First, perform a meta-analysis of approaches used: • Stratified sample of 150 research products analyzing survey data from the Science and Engineers Statistical Data System (SESTAT), sponsored by NCSES • Google Scholar searches, organized by decade • Products ordered by decade; systematic sampling • Sample 50 articles presenting secondary analyses of each of three main SESTAT surveys (all having complex samples): • National Survey of College Graduates (NSCG) • Survey of Doctorate Recipients (SDR) (2 ineligible, no replacements) • National Survey of Recent College Graduates (NSRCG) (3 ineligible) ITSEW 2018
Study Design, cont’d • Code the 150 articles on the following items: • Year available online, type of research product • Did the analysis account for weights? • Did the analysis account for design features in variance estimation? • Was the approach design-based or model-based? • Did the authors use appropriate software? • Did the authors perform appropriate subpopulation analyses (for design-based analyses)? • Did the authors describe their results with respect to the target population? • For journal articles: Impact factor? Statisticians on editorial board? Guidelines for survey data analysis on web site? ITSEW 2018
Study Design, cont’d • Next, examine the implications of making analytic errors for analyses of SESTAT data: • Download the 2010 public-use SDR and NSCG data • Obtain the replicate weights for variance estimation from NCSES (available upon request) • Review the sampled articles and work with NCSES staff to identify: • Key descriptive estimates • Regression models of substantive interest ITSEW 2018
Study Design, cont’d • Perform three types of analyses for both descriptive and analytic (regression) parameters: • Fully accounting for complex sampling features • Accounting for weights only, using Taylor Series Linearization for variance estimation • Ignoring complex sampling features entirely • Consider ratios of variance estimates to assess misspecification effects, due to ignoring key sampling features in the analyses ITSEW 2018
Results: Meta-Analysis ITSEW 2018
Results: Meta-Analysis The probability of using weights The probability of correct variance estimation The probability of correct population description The probability of correct subpopulation estimation ITSEW 2018
Results: Meta-Analysis • No variance in “apparent” error rates depending on the type of research product • Journal articles were the least likely to use appropriate variance estimation (!) • Having statisticians on the editorial board or as reviewers increased the probability of using appropriate methods • Model-based approaches were particularly likely to ignore design features; vague references to “robust” standard errors • Almost no references to the use of appropriate software • Journals almost never provide guidance with regard to secondary analysis of survey data on their web sites ITSEW 2018
Results: Implications of Errors • Among 8 categorical variables in the 2010 SDR, inferences related to estimated distributions in the population would change for 5 of the variables if design features were ignored: • Current salary, race/ethnicity, attending professional meetings in the past year, major field of study, and labor force status (changes generally small) • Among 10 continuous and categorical variables in the 2010 NSCG, there would be substantial changes in inference for 9 of the variables! ITSEW 2018
Results: Implications of Errors • An extreme example from the 2010 NSCG: • Primary Job in Science and Engineering (key indicator!): • Fully accounting for complex sampling: • 30.38% (SE = 0.30%) • Accounting for final weights only: • 30.38% (SE = 0.39%; no gains from stratification!) • Completely ignoring complex sampling: • 54.94% (SE = 0.20%) (!!!!!) • Weights were highly correlated with several other measures: race/ethnicity, highest degree, salary, major degree, etc. ITSEW 2018
Results: Implications of Errors • In a logistic regression model fitted to a binary indicator of having an annual salary > $150K, inference related to the interaction between major degree and race/ethnicity would change: • Design-adjusted Wald test, fully accounting: p = 0.019 • Design-adjusted Wald test, weights only: p = 0.278 • Wald test, ignoring all features: p = 0.139 • No major effects on an ordinal regression model of hours worked per week, predicted by race/ethnicity, principal job type, and their interaction ITSEW 2018
Results: Implications of Errors • In a regression model fitted to log-transformed current salary in the 2010 NSCG, the main effect of having an S & E degree would change completely: • Fully accounting for complex sampling: 0.16 (SE = 0.03) • Ignoring complex sampling features: 0.02 (SE = 0.02) • In a logistic regression model for having an S & E job in the 2010 NSCG, inference about the interaction between race/ethnicity and gender would change radically: • Fully accounting: p = 0.1944; Ignoring: p < 0.0001 ITSEW 2018
Summary of Results • Meta Analysis: Secondary analysts of SESTAT data only account for weights about 50% of the time, and rarely perform variance estimation or subpopulation analysis correctly (plus, no trends over time) • Consistent with initial review of public health research • Some journal features help (e.g., statistical reviewers) • Implications of Errors: When failing to account for complex sampling features, implications for inference can be quite severe! • Weights can be highly correlated with key variables • Gains in efficiency from stratified sampling are missed ITSEW 2018
Study Design: 2013 BRDIS • No work to date has considered the analytic error problem in the establishment survey context • We reviewed the methods used in heavily-cited publications presenting analyses of establishment survey data • We then considered the implications of failing to account for sample design features in a real establishment survey ITSEW 2018
Study Design: 2013 BRDIS • We again used Google Scholar to identify highly-cited articles presenting secondary analyses of establishment survey data • We then performed alternative analyses of data (e.g., with and without weights) from the 2013 Business Research and Development and Innovation Survey (BRDIS) • We also considered the effects of ignoring the stratification in the BRDIS sample design ITSEW 2018
BRDIS Disclaimer • This research uses data from the U.S. Census Bureau's Longitudinal Employer Household Dynamics Program, which was partially supported by National Science Foundation Grants SES-9978093, SES-0339191 and ITR-0427889; National Institute on Aging Grant AG018854; and grants from the Alfred P. Sloan Foundation. Any opinions and conclusions expressed herein are those of the author(s) and do not necessarily represent the views of the U.S. Census Bureau. All results have been reviewed to ensure that no confidential information is disclosed. ITSEW 2018
Results: Meta-Analysis • Of the 10 most highly-cited articles (median citation count = 412.5, median impact factor = 2.86), only two out of ten even mentioned using weights at all • None of the articles mentioned accounting for the sample design features (e.g., stratification) when estimating variances ITSEW 2018
Results: Estimation of Means ITSEW 2018
Results: Regression Modeling ITSEW 2018
BRDIS 2013: Summary of Results • Failing to account for weights in the 2013 BRDIS led to substantial changes in inference, for both means and regression coefficients (see the tables of estimates above, and note that sample sizes have been rounded) • A failure to account for the stratified sample design of the 2013 BRDIS led to overly conservative inferences ITSEW 2018
Suggestions for Practice • Reviewers and consumers of these research products need to take more care in ensuring that appropriate analytic methods have been used • Transparency regarding analytic methods is critical for verifiable and reproducible research • Web sites for journals should provide specific guidance about this issue for article submissions • Additional replications of the BRDIS study are critical! • 10 highly-cited journal articles analyzing PISA and NAEP data: 4 (40%) appeared to use incorrect methods! ITSEW 2018
Current Software Tools • Possible combinations of research objectives and analysis approaches • Software options: • SAS, SPSS, Stata, R, WesVar, SUDAAN, HLM, Mplus, IVEware, VPLX, CENVAR, Epi Info, AM Software, Bascula, CLUSTERS, Generalized estimation system, PCCARP
References • West, B.T., Sakshaug, J.W. and Aurelien, G.A.S. (2016). How Big of a Problem is Analytic Error in Secondary Analyses of Survey Data? PLOS One, 11(6), e0158120. • West, B.T., Sakshaug, J.W. and Kim, Y. (2017). Analytic Error as an Important Component of Total Survey Error: Results from a Meta-Analysis. In P. Biemer, E. de Leeuw, S. Eckman, B. Edwards, F. Kreuter, L.E. Lyberg, N.C. Tucker, and B. West (Eds.). Total Survey Error in Practice. Hoboken, NJ: John Wiley and Sons, pp. 489-508. • West, B.T. and Sakshaug, J.W. (2018). The Need to Account for Complex Sampling Features when Analyzing Establishment Survey Data: An Illustration using the 2013 Business Research and Development Innovation Survey (BRDIS). Survey Methods: Insights from the Field, forthcoming. • West, B.T., Sakshaug, J.W. and Aurelien, G.A.S. (Forthcoming). Accounting for Complex Sampling in Survey Estimation: A Review of Current Software Tools. Journal of Official Statistics. • Please direct questions, thoughts, or comments to bwest@umich.edu and joe.sakshaug@iab.de
Thank You! • All cited references are available upon request • The SAS code that can be used to immediately replicate these analyses (or code in any other packages) is available upon request ITSEW 2018