Download
1 / 19
190 likes | 309 Vues
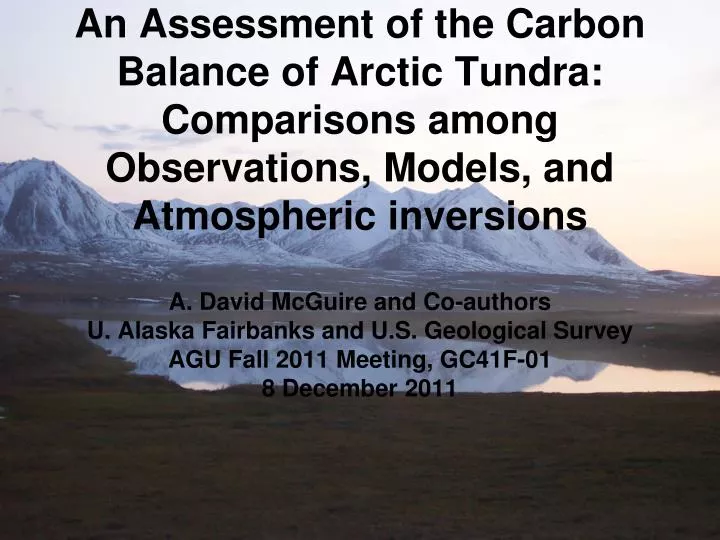
An Assessment of the Carbon Balance of Arctic Tundra: Comparisons among Observations, Models, and Atmospheric inversions A. David McGuire and Co-authors U. Alaska Fairbanks and U.S. Geological Survey AGU Fall 2011 Meeting, GC41F-01 8 December 2011. Lead Authors:

E N D
An Assessment of the Carbon Balance of Arctic Tundra:Comparisons among Observations, Models, and Atmospheric inversionsA. David McGuire and Co-authorsU. Alaska Fairbanks and U.S. Geological SurveyAGU Fall 2011 Meeting, GC41F-018 December 2011
Lead Authors: A.D. McGuire – University of Alaska Fairbanks, USA T. R. Christensen – Lund University, Sweden • Co-authors: • Dan Hayes – Oak Ridge National Laboratory, USA • Arnaud Heroult – Lund University, Sweden • Eugenie Euskirchen – University of Alaska Fairbanks, USA • John Kimball – University of Montana, USA • Charles Koven – Lawrence Berkeley National Lab, USA • Peter Lafleur – Trent University, Canada • Paul Miller – Lund University, Sweden • Walt Oechel – San Diego State University, USA • Philippe Peylin – LSCE, France • Mathew Williams – University of Edinburgh, UK
Is the CO2sink of N. High Latitudes Changing? SOURCE SINK From Hayes et al. (2011, Global Biogeochemical Cycles)
Simulated Arctic Basin Terrestrial C Budget Mean annual C fluxes and change in stocks (Tg C yr-1) for the terrestrial component of the Arctic Basin, 1997 - 2006 From McGuire et al. (2010, Tellus)
Arctic Tundra Domain as defined by the Regional Carbon Cycle Assessment and Processes (RECCAP) Synthesis Activity
Results Organization • Estimates based on flux observations • Process model estimates • Atmospheric inversion analyses • Comparison of the estimates • Conclusions
Analysis of Observations • Includes both chamber-based and tower-based studies • 250 estimates of CO2 and CH4 exchange
Synthesis of Tundra Observations • Annual exchange of CO2 cannot be distinguished from neutral balance • across the range of studies that have been conducted
Process-based Modeling • Regional Applications of Models: • - TEM6 – Permafrost, Vertical SOM, CH4, Fire • - LPJ-Guess WHyMe – Permafrost, CH4, Fire • - Orchidee – with Cryoturbation • - Terrestrial Carbon Flux (TCF) – Diagnostic Model • Global Applications of Trendy DGVMs: CLM4C, CLM4CN, • Hyland, LPJ, LPJ-Guess, Orchidee N, SDGVM, • Triffid • Compared two decades: 1990 – 1999 and 2000 - 2006 • Spatial domain defined by RECCAP Arctic Tundra mask
Mean NEE of Arctic Tundra Simulated by Process Models • NEE ranged between 0 and 34 g C m-2 yr-1 sink; sink increases between decades
Mean Seasonal Cycle of Carbon Fluxes • All of the models indicate that July is the month of maximum NPP and NEP.
Interannual Anomalies of Carbon Fluxes • Three of the four models have a similar range of interannual variability in GPP, NPP, RH, and NEP. • Correlations among the models indicate that GPP, NPP, and RH are generally well correlated among the models, but the interannual variability in NEP is poorly correlated among the models.
Atmospheric Inversion Modeling • 10 models • 1985 – 2009 depending on model • Spatial domain defined by RECCAP Arctic Tundra mask
Mean NEE of Arctic Tundra Estimated by Inversion Models • NEE ranged between 26 g C m-2 yr-1 source and 48 g C m-2 yr-1 sink • Sink increases between decades
Mean Seasonal Cycle of Carbon Fluxes of Inversions All of the models indicate that July is the month of maximum NEE.
Interannual Variability of Carbon Fluxes from Inversions • Interannual anomalies vary from 2.1 to 13.1 g C m-2 yr-1 (standard deviation) • Correlation of interannual anomalies is poor (mean r=0.03, range: -0.38 to 0.99)
Comparison of Regional NEE among Methods (Tg C yr-1) • Observations and Inversions – Can’t be distinguished from neutral balance • Process-Model Simulations – Arctic tundra has been a sink in the 1990s and 2000s • Only one central estimate is a source (observations in 1990s – North America) • All methods indicate that Arctic tundra has become a stronger sink in the 2000s
Changes in the Seasonal Cycle of NEP Estimated by the Regional Process Models • LPJ-Guess WHyMe and Orchidee estimate greater uptake in early and mid-growing • season, while TEM6 estimates greater uptake in the late growing season
Arctic Tundra C Assessment Conclusions • Estimates of NEE based on observations and inversions • have large uncertainties that cannot be distinguished • from neutral balance. • Process models indicate that Arctic tundra acted as a • sink for CO2 in recent decades. • Central estimates based on observations, process- • models, and inversions each suggest stronger sinks in • the 2000s than in the 1990s. • Analyses of regional models identified that two of the • models had increased CO2 uptake in early and mid- • growing season between decades, while a third model • had greater uptake in the late growing season. • Simulation of the difference between production and • decomposition is important to improve for assessing • responses of Arctic tundra to projected climate change