Download
1 / 94
1.17k likes | 2.09k Vues
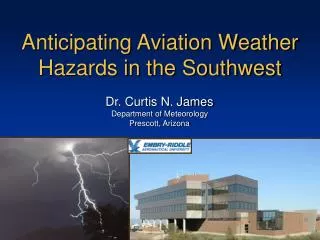
Aviation Weather Hazards. Weather radar, observing equipment and balloon launching on roof. Mark Sinclair Department of Meteorology Embry-Riddle Aeronautical University Prescott, Arizona. ERAU Academic Complex. Weather center. Talk Overview. Survey of weather related accidents Turbulence

E N D
Aviation Weather Hazards Weather radar, observing equipment and balloon launching on roof Mark Sinclair Department of Meteorology Embry-Riddle Aeronautical University Prescott, Arizona ERAU Academic Complex Weather center
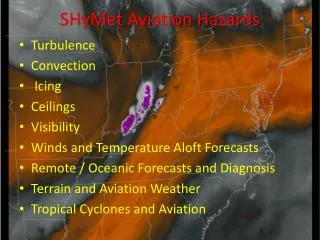
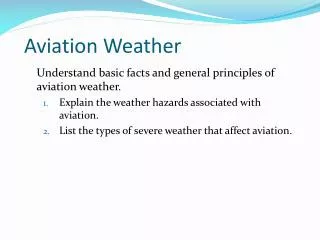
Talk Overview • Survey of weather related accidents • Turbulence • Low-level turbulence and surface wind • Thermal turbulence • Microbursts • Mountain wave turbulence • IMC conditions
All weather related accidents • The following data are from the FAA’s National Aviation Safety Data Analysis Center (NASDAC), Office of Aviation Safety, Flight Standards Service and are based on NTSB accident data. • Data from all accidents, the majority non-fatal • http://www.asias.faa.gov/aviation_studies/weather_study/studyindex.html
Nearly 87% or 7 out of 8 of these involved general aviation operations General Aviation GA Commuter Ag Air carrier
19,562 total accidents 4,159 (21.3%) weather related Main cause = wind
GA weather-related fatalities – a study by D.C. Pearson (NWS) • http://www.srh.noaa.gov/topics/attach/html/ssd02-18.htm • Looked at NTSB data from 2,312 GA fatal accidents in the US during 1995-2000 • Weather a factor in 697 or 30% of all GA fatalities • A similar study by AOPA showed an average of 35% but declining • Weather a bigger factor in FATAL accidents than for non-fatal
GA weather related fatalities (cont.) • NTSB cited NWS weather support to be a contributing factor in only two (0.3%) of the 697 weather-related fatal accidents. • NTSB cited FSS support to be a factor in only five (0.7%) of the accidents. • NTSB cited inadequate ATC support only nine times (1.3%) • Combined, NWS, FSS and ATC = 2.3% • Pilot error accounted for remaining 97.7% • Continued flight into IMC the leading cause of GA weather-related fatalities
Flight Safety and Weather • Clearly, the responsibility for flight safety is YOU, the pilot • You need to brief (up to 41% don’t) • Clear sky and light wind now does not mean it will be that way • One hour from now • 50 miles from here • 1,000 ft AGL
Aviation Weather Hazards • Surface wind is the major listed hazard in in ALL weather related GA accidents • Continued flight into IMC conditions (reduced visibility and/or low ceilings) the leading cause of FATAL GA accidents
A. Turbulence • “Bumpiness” in flight • Four types • Low-level turbulence (LLT) • Turbulence near thunderstorms (TNT) • Clear-air turbulence above 15,000 ft (CAT) • Mountain wave turbulence (MWT) • Measured as • Light, moderate or severe • G-load, air speed fluctuations, vertical gust
Turbulence in PIREPs Turbulence Frequency Turbulence Intensity
Turbulence • Can be thought of as random eddies within linear flow Hi! I’m an eddy +
20 kt gust + 5 kt eddy updraft downdraft 15 kt wind 10 kt lull Turbulence • Linear wind and eddy components add to gusts and lulls, up and down drafts that are felt as turbulence
Low-level Turbulence (LLT) • Occurs in the boundary layer • Surface layer of the atmosphere in which the effect of surface friction is felt • Typically 3,000 ft deep, but varies a lot • Friction is largest at surface, so wind increases with height in friction layer • Vertical wind shear turbulence • Important for landing and takeoffs • Results in pitch, yaw and roll
Factors that make low-level turbulence (LLT) stronger • Unstable air – encourages turbulence • Air is unstable when the surface is heated • Air is most unstable during the afternoon • Cumulus clouds or gusty surface winds generally indicate an unstable atmosphere • Strong wind • More energy for turbulent eddies • Rough terrain • When LLT is stronger than usual, the turbulent layer is deeper than usual
Low-level turbulence (LLT) • Mechanical • Created by topographic obstacles like mountains, and by buildings and trees • Increases with increasing flow speed and increasing surface heating (afternoon) • Thermal • Occurs when air is heated from below, as on a summer afternoon • Increases with surface heating
Mechanical Turbulence • Created by topographic obstacles in flow • Increases in both depth and intensity with increasing wind strength and decreasing stability. Worst in afternoon • Extends above 3000 ft for gusts more than 50 kt • Strongest just downwind of obstacles • Over flat terrain, mechanical turbulence intensity is usually strongest just above surface and decreases with height
Mechanical Turbulence (cont.) • Over flat terrain • Maximum surface wind gusts are typically 40% stronger than the sustained wind • Moderate or greater turbulence for surface wind > 30 kt • When sustained surface wind exceeds 20 kt, expect air speed fluctuations of 10-20 kts on approach • Use power on approach and power on landing during gusty winds • Sudden lulls may put your airspeed below stall
Thermal turbulence • Produced by thermals (rising bubbles of warm air) during day in unstable airmass • Common on sunny days with light wind • Stronger above sun-facing slopes in pm • Turbulence intensity typically increases with height from surface and is strongest 3-6,000 ft above the surface
Thermal turbulence (cont.) • Generally light to moderate • Commonly reported CONT LGT-MOD • Usually occurs in light wind situations, but can combine with mechanical turbulence on windy days • Often capped by inversion • Top of haze layer (may be Sc cloud) • ~3,000 ft, but up to 20,000 ft over desert in summer • Smoother flight above the inversion
Deep summer convective boundary layer causes thermal turbulence (more stable air above) up to 20,000’ MSL thermal thermal dust devil Hot, dry, unstable air
Towering cumulus over Prescott Fall 2000 Photo by Joe Aldrich
45 kt downburst Flight path of plane 45 kt headwind 45 kt tailwind Dry microbursts from high based thunderstorms • When precipitation falls through unsaturated air, evaporative cooling may produce dry microbursts • Result in very hazardous shear conditions • Visual clue: fallstreaks or virga (fall streaks that don’t reach the ground)
Downburst (Phoenix, AZ) July 2003—Photo by Phillip Zygmunt
Downburst (Prescott Valley, AZ) 1999—Photo by Jacob Neider
The nocturnal boundary layer • Clear nights, moderate flow • Shallow friction layer • Greatly reduced turbulence • Lack of mixing possibility of strong vertical shear • Surface air decoupled from gradient flow in free air above friction layer • Surface flow often unrelated to pressure pattern (and flow above friction layer) • May have super-gradient flow and turbulence at top of inversion
Friction layer during night Friction layer during day 3,000 ft Deep turbulent friction layer Shallow non-turbulent friction layer Strong turbulence during day means a deep layer is stirred Mixing means 3,000 ft wind better mixed down to surface Stronger turbulence, reduced vertical wind shear Reduced turbulence means only a shallow layer is mixed Suppressed downward mixing means surface wind falls to near zero at night Stronger vertical shear
Wind at 3,000 ft AGL 30 Surface wind is stronger and more turbulent during afternoon Surface wind 20 Wind speed (kt) 10 0 Midnight 6am noon 6pm Midnight Diurnal variation of surface wind
In mountainous terrain ... • Watch for strong downdrafts on lee side • Climb above well above highest peaks before crossing mountain or exiting valley • Intensity of turbulence increases with wind speed and steepness of terrain • Highest wind speed directly above crest of ridge and on downwind side • Maximum turbulence near and downwind of mountain
Air flow over mountains Airflow Upwind Downwind Orographic cloud and possible IMC conditions on upwind side Strongest wind speed and turbulence on downwind side, also warm and dry Desired flight path Actual flight path Splat! Mountain
Mountain wave turbulence (MWT) • Produces the most violent turbulence (other than TS) • Occurs in two regions to the lee of mountains: • Near the ground and • Near the tropopause • Turbulence at and below mountain top level is associated with rotors • Turbulence near tropopause associated with breaking waves in the high shear regions just above and below trop
Rules of Thumb for Predicting Turbulence Stratosphere Tropopause Turbulent Layer 2 2kft above to 6kft below trop Troposphere Lenticular Cloud Roll Cloud Cap Cloud Turbulent Layer 1 - SFC-~7kft above peaks Miles 0 2 4 6 8 10 12 14 16 18 20 Mountain Wave (> 25kt perpendicular component /stable air are key)
MWT (cont) • Severity increases with increasing wind speed at mountain crest • For mountain top winds between 25 and 50 kt, expect mod turb at all levels between the surface and 5,000 ft above the trop • For mountain top winds > 50 kt, expect severe turb 50-150 miles downstream of mountain at and below rotor level, and within 5,000 ft of the tropopause • Severe turb in boundary layer. May be violent downslope winds • Dust may indicate rotor cloud (picture)
Mountain wave terminology Breaking waves Wave clouds (altocumulus lenticularis) Inversion Fohn cloudwall Hydraulic jump rotor
Mountain Waves • Mountain waves become more pronounced as height increases and may extend into the stratosphere • Some pilots have reported mountain waves at 60,000 feet. • Vertical airflow component of a standing wave may exceed 8,000 feet per minute • Vertical shear may cause mountain waves to break, creating stronger turbulence • Often happens below jet streak or near front
Breaking Wave Region • Vertically-propagating waves with sufficient amplitude may break in the troposphere or lower stratosphere.
Wind Rotor cloud cap cloud Rotor cloud
Lee Waves • Lee waves propagate horizontally because of strong wind shear or low stability above.These waves are typically at an altitude within a few thousand feet of the mountain ridge crest.
Lee waves (cont.) • Lee waves are usually smooth, however, turbulence occurs in them near the tropopause • Avoid lenticular cloud with ragged or convective edges • Watch for smooth (but rapid) altitude changes Lee wave clouds in NZ