Download
1 / 1
10 likes | 124 Vues
4/25/2005. 04/04/2003. CB. Inter-comparison of Satellite Algal Bloom Detection Techniques Using Surface and Top of Atmosphere Signals. MCI. Students: May Chum and Pierre Ramos Mentors: Prof. Alex Gilerson, Ruhul Amin, PhD Student, Dept. of EE, CCNY. EBI. ABSTRACT. RESULTS.

E N D
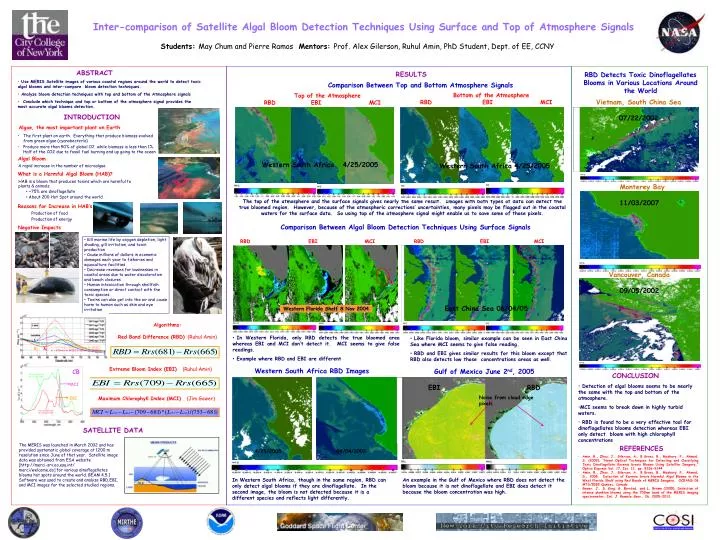
4/25/2005 04/04/2003 CB Inter-comparison of Satellite Algal Bloom Detection Techniques Using Surface and Top of Atmosphere Signals MCI Students: May Chum and Pierre RamosMentors: Prof. Alex Gilerson, Ruhul Amin, PhD Student, Dept. of EE, CCNY EBI ABSTRACT RESULTS RBD Detects Toxic Dinoflagellates Blooms in Various Locations Around the World • Use MERIS Satellite images of various coastal regions around the world to detect toxic algal blooms and inter-compare bloom detection techniques. • Analyze bloom detection techniques with top and bottom of the Atmosphere signals • Conclude which technique and top or bottom of the atmosphere signal provides the most accurate algal blooms detection. Comparison Between Top and Bottom Atmosphere Signals Bottom of the AtmosphereRBD EBI MCI Top of the AtmosphereRBD EBI MCI Vietnam, South China Sea 07/22/2002 INTRODUCTION Algae, the most important plant on Earth • The first plant on earth. Everything that produce biomass evolved from green algae (cyanobecteria) • Produce more than 50% of global O2 while biomass is less than 1%. Half of the CO2 due to fossil fuel burning end up going to the ocean Algal Bloom Western South Africa 4/25/2005 Western South Africa 4/25/2005 A rapid increase in the number of microalgae What is a Harmful Algal Bloom (HAB)? • HAB is a bloom that produces toxins which are harmful to plants & animals. • ~75% are dinoflagellate • About 200 Hot Spot around the world Monterey Bay 11/03/2007 The top of the atmosphere and the surface signals gives nearly the same result. Images with both types of data can detect the true bloomed region. However, because of the atmospheric corrections’ uncertainties, many pixels may be flagged out in the coastal waters for the surface data. So using top of the atmosphere signal might enable us to save some of those pixels. Reasons for Increase in HAB’s • Production of food • Production of energy Comparison Between Algal Bloom Detection Techniques Using Surface Signals Negative Impacts • Kill marine life by oxygen depletion, light shading, gill irritation, and toxin production • Cause millions of dollars in economic damages each year to fisheries and aquaculture facilities • Decrease revenues for businesses in coastal areas due to water discoloration and beach closures • Human intoxication through shellfish consumption or direct contact with the toxic species • Toxins can also get into the air and cause harm to human such as skin and eye irritation RBD EBI MCI RBD EBI MCI Vancouver, Canada 09/05/2002 East China Sea 06/04/05 Western Florida Shelf 8 Nov 2004 λ1 λ2 λ1 = 667nm for MODIS/665nm for MERIS λ2 = 678nm for MODIS/681nm for MERIS Algorithms: Red Band Difference (RBD) (Ruhul Amin) • In Western Florida, only RBD detects the true bloomed area whereas EBI and MCI don’t detect it. MCI seems to give false readings. • Example where RBD and EBI are different • Like Florida bloom, similar example can be seen in East China Sea where MCI seems to give false reading. • RBD and EBI gives similar results for this bloom except that RBD also detects low those concentrations areas as well. Extreme Bloom Index (EBI) (Ruhul Amin) Western South Africa RBD Images Gulf of Mexico June 2nd, 2005 EBI RBD CONCLUSION • Detection of algal blooms seems to be nearly the same with the top and bottom of the atmosphere. • MCI seems to break down in highly turbid waters. • RBD is found to be a very effective tool for dinoflagellates blooms detection whereas EBI only detect bloom with high chlorophyll concentrations Noise from cloud edge pixels Maximum Chlorophyll Index (MCI) (Jim Gower) SATELLITE DATA The MERIS was launched in March 2002 and has provided systematic global coverage at 1200 m resolution since June of that year. Satellite image data was obtained from ESA website [http://merci-srv.eo.esa.int/ merci/welcome.do] for various dinoflagellates blooms hot spots around the world. BEAM 4.5.1 Software was used to create and analyze RBD,EBI, and MCI images for the selected studied regions. REFERENCES • Amin, R., Zhou, J., Gilerson, A., B Gross, B., Moshary, F., Ahmed, S. (2009), “Novel Optical Techniques for Detecting and Classifying Toxic Dinoflagellate Karenia brevis Blooms Using Satellite Imagery,” Optics Express Vol. 17, Iss. 11, pp. 9126-9144 • Amin, R., Zhou, J., Gilerson, A., B Gross, B., Moshary, F., Ahmed, S., 2008. Detection of Karenia brevis Harmful Algal Blooms in the West Florida Shelf using Red Bands of MERIS Imagery. OCEANS 08 MTS/IEEE Quebec, Canada • Gower, J., S. King, G. Borstad, and L. Brown (2005), Detection of intense plankton blooms using the 709nm band of the MERIS imaging spectrometer, Int. J. Remote Sens., 26, 2005-2012. In Western South Africa, though in the same region, RBD can only detect algal blooms if they are dinoflagellate. In the second image, the bloom is not detected because it is a different species and reflects light differently. An example in the Gulf of Mexico where RBD does not detect the bloom because it is not dinoflagellate and EBI does detect it because the bloom concentration was high.