Download
1 / 36
390 likes | 599 Vues
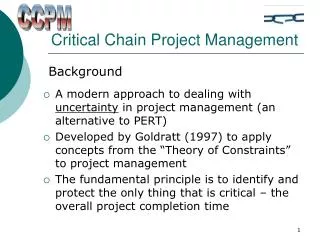
Critical Chain Project Management. Case Study Application and Lessons Learned. Prepared for PMI Montgomery Chapter February Chapter dinner February 6, 2013 Mike Hannan, VP, Public Sector Services Hilbert Robinson, Senior Program Manager. Objectives.

E N D
Critical Chain Project Management Case Study Application and Lessons Learned Prepared for PMI Montgomery Chapter February Chapter dinner February 6, 2013 Mike Hannan, VP, Public Sector Services Hilbert Robinson, Senior Program Manager
Objectives Use Actual Case Studies to address typical questions about the applicability of CCPM to real life project/program management challenges Stimulate thinking about how you might apply this yourselves
Agenda • Brief Review of “The Three New Rules” of CCPM • Case Study # 1 : Redesign of Commercial Jetliner • Case Study # 2 : Nuclear Submarine Maintenance • Q & A
New Rules Old Rule Advantage New Rule Problem Faster project and a more reliableproject commitment. Plan each task as a highly reliable commitment. Buffer Projects, Not Tasks Task variability preventsreliable project commitments. 1 Focusing staff on 1 taskat a time results in low resource utilization, andholds up other projects. Assign staff to multipletasks, and start all projectsas early as possible. Maximize project completion rate and resource utilization. Stagger Projects 2 Priorities across projectsshift, resulting in persistent conflicts over resources. Each PM lobbies the PMOfor critical resources. Clarity, commonly agreedpriorities, strongercooperation among PMs Protect ProjectBuffers ThatNeed It Most 3 Change the rules, change the game, change results, close the gap
Case Study Format • Background, Performance Gap • Implementation Challenges • Approach / Application of the New Rules • Results • Lessons Learned
Case Study # 1 – New Product Development The Application of CCPM to the Re-design of Commercial Jet Liner
Background / Performance Gap • Program budget is lowest ever – dictated by promises to investors • Program schedule is shortest ever – dictated by promises to the market • Program delivery date is set and not negotiable • Executive in charge of only part of the program • Only half the staff located at main site, 25% are overseas • Must implement EVM and other “Best Practices” • Mechanical Engineering Only • Several hundred scientists, designers, analysts and technicians involved • Budget in the high 9 figures • Sub-contractors not involved Program Launch Conceptual Design Preliminary Design Detail Design Fabrication Assembly Test Delivery
Additional Challenges and Special Considerations • How to draw boundaries around the resource pools • What do we define as a project • What work statement to include or ignore • How much of the value stream to include • Should we do a pilot • How to integrate with other best practices / avoid turf wars • Should we also consider: • Budget buffers • Scope / performance buffers
Approach / application of the rules • Independent cross functional product teams by airplane sections • Program management specialist does both EVM and CCPM • Build CCPM team plan first then convert to EVM baseline • Standardize the design and drawing release process • Each drawing is a project, hundreds of projects per team • Use common template library for ease of planning and integration of reporting across multiple teams • Build comprehensive load to capacity model for each team • Initially, no staggering – dates already set • Instead, analyze staffing requirements and adjust staffing plans • Renegotiate supplier commitments where necessary Team Team Team Team Team Team
Example Multi-Project Dashboard Different shaped dots for different types of deliverables Approaching the end of the program
Approach / Application of Rules Poster Used to Communicate Desired Behavior All team members work to the same priorities Critical Chain Execution Run Rules Team members share responsibility for project deliverables • Status by estimating duration remaining, not % complete NO multi-tasking Plan using 50% probabilities for task durations, not 80% Seek out, identify and resolve issues quickly Finish when you’re done, not when it’s due Start only when ALL the prerequisites are complete
Results Earned Value Reports-Before Business as usual Crisis Performance to PUSH system—late and over budget Question: Please predict how the chart looks from this point to the end of the program. Cost Performance Index (CPI) Schedule Performance Index (SPI)
Results Earned Value Reports-After New mode of operations Business as usual Radically and rapidly increased system performance Crisis Did you guess correctly? Be honest Cost Performance Index (CPI) Schedule Performance Index (SPI)
Engineering thought that this was a VERY aggressive schedule Results Second Airplane Program Working to flow events and NOT to due dates Even shorter schedule yet finished 3 months early!! Two weeks of xmas break 12 weeks ahead 8 weeks ahead 4 weeks ahead 3 weeks ahead
Lessons Learned • Trust the data or, fix the data then, trust the data • No compelling need or reason to get better, no compelling results • Buffer Watching is not the same as Buffer Management • EVM and CCPM works together just fine, if you want them to • CCPM Scales up just fine • Benefits grow with increased alignment over a larger span of control • Quality improves with improved focus • Some people will have a hard time making the switch • 100% compliance is not a pre-requisite • It is not just about scheduling. Focus on behaviors • It is not about the software • Trust the data or, fix the data then, …
Case Study # 2 Find picture of fast attack submarine The Application of CCPM to the Repair of Nuclear Submarines Navy – Pearl Harbor
Case Study Format • Background / Performance Gap • Implementation challenges • Approach / Application of the rules (deviations) • Results • Lessons Learned
Background / Performance Gap • Pearl Harbor Naval Shipyards employ about 4,000 people • Maintain and modernize submarines • Projects start and end at a pre-determined time • Much of the work is identified after project starts • Tasks completed using 81 specific trade skills
Background / Performance Gap 2002 Data Total Workforce 23,530 Attrition 1,129 33%over 50 5311 5065 Workforce Age Profile 3887 Naval Shipyard End Strength 2326 2066 1707 1306 1051 100 493 Expect high attrition – must refresh workforce - maintain critical skills
Background / Performance Gap Uncertainty • Neither the scope nor the work content is clear upfront, but we need to make firm commitments before the projects begin Not enough capacity • Our people (and equipment) resources are already overloaded, but we keep accepting more projects Aggressive schedules • It already takes heroic efforts to meet due-dates, yet we are being asked to deliver more scope in lesser time Complexity • Fixing Hundreds of components, in dozens of integrated systems • Severe space constraints – space is a limited resource • Highly dependent on specialized skills in short supply
Background / Performance Gap Constraining Business Rules/Practices • Managing the money got in the way of managing the work • Bad measures driving people to behave badly • Poor planning (confusion between work breakdown and workflow logic) • Multi-tasking – staying busy but not making progress • Parkinson's Law – Keep jobs open until all money has been spent
Background / Performance Gap • Customers disillusioned with late projects • Multiple scheduling tools and work lists • Job timelines inconsistent • Multiple priority lists across the organization • Difficulty in correctly prioritizing jobs • Increasing management complexity with contractors • No appropriate tool for balancing resources • No means for evaluating impact of new work • No means to validate necessity of overtime
Background / Performance Gap Proud tradition and impressive accomplishments, but… There still existed a substantial gap. Add to this picture: • Six months post 9/11 • There is an X-fold increase in the need for secret missions
Implementation Challenges • How to deal with the nuclear culture – all changes increase safety risk • How to plan when 30% of the work has not yet been identified • How to integrate work being done by shipboard personnel • How to integrate work being done by contractors • How to integrate work being done in the many production shops • How to handle a single CCPM project in a multi-project environment • How to deal with fixed start AND finish dates • How do deal with high volume of non-project work • Getting permission to ignore / modify business rules / practices
Approach / Application of the Rules • Used templates and place holders to complete planning quickly • Joint planning sessions with contractors and crew • Modeled physical space as resources • Separate “misc work” file reduced schedule clutter • Free standing Local Area Network to address IT/security concerns • Use schedule to determined and renegotiate due dates • Not able to officially implement pipelining / (pseudo stagger) • Full load to capacity picture for the first time • Identified pockets of hidden resources • Identified urgent cross training needs – shifted manpower around • All over time decisions made based on buffer recovery expectations
Approach / Application of the Rules Typical process to repair a single component This step does the work Summarized to seven schedulable steps and replicate for each component
Focused Use of Overtime 35.0% $2,750,000 $2,489,450 29.8% 30.0% $2,250,000 $2,220,402 27.7% $2,187,398 $2,015,968 $1,981,335 25.0% $1,750,000 20.0% $1,398,487 17.4% % Overtime Overtime Cost per Quarter $1,250,000 14.9% 14.6% 15.0% 13.0% 12.5% $750,000 10.1% 10.0% $250,000 5.0% 0.0% -$250,000 May 2003 2000 2001 1Q02 2Q02 3Q02 4Q02 1Q03 2Q03
On Time Completion 24 This chart displays the "On Time Completion" metric for the 23 last 35 availabilities. It also superimposes a 10 Availability 22 moving average line. The small tick marks at the axis indicate 21 on time completion. Numbers above the line indicate late, 20 numbers below the line indicate early. 19 18 17 16 15 14 13 12 11 10 Days Early (-) Late (+) 9 8 7 6 5 4 3 2 1 - (1) 11/16/01 11/19/01 12/03/01 12/05/01 02/04/02 02/04/02 02/21/02 02/25/02 02/25/02 03/18/02 03/19/02 04/01/02 04/08/02 04/18/02 04/29/02 05/31/02 05/31/02 06/06/02 06/24/02 07/19/02 07/23/02 07/31/02 09/09/02 08/21/02 09/16/02 09/27/02 09/22/02 09/30/02 10/14/02 11/04/02 11/12/02 11/13/02 12/16/02 01/18/03 02/03/03 (2) (3) (4) (5) May 2003 Avail Start Date
Improved Schedule Adherence This chart displays the "On Time Completion" metric. The ratio is 1.20 the total number "On Time" versus the total completed. (This is the equivalent of the Schedule Indicator in the DMOIs.) The Goal 1.00 0.80 % On Time 0.60 0.40 0.20 0.00 2000 2001 1Q02 2Q02 3Q02 4Q02 1Q03 2Q03 May 2003 Quarter
Background / Performance Gap Proud tradition and impressive accomplishments, but… There still existed a substantial gap. Performance Gap significantly reduced!!!
Critical Success Factors • Project schedules buffered, with aggressive task estimates • Modeling is not too granular, and does not require too much data • Pipeline is level-loaded at the constraints only, with adequate protective capacity for all resources • Task priorities are followed and tasks are regularly updated • Buffer recovery is planned and managed • Resource requirements are proactively managed • Write new planning and execution process guides • Use CCPM to focus other initiatives • Revise performance metrics and accounting process • Conduct CCPM expert training for stabilization
Transformation Challenges • System (holistic) versus functional (silo) perspective • Multiple initiatives / change overload • Frequent changes in military and civilian leadership • Difficult to change large project midstream • Full benefits not visible for single projects in the multi-project, multi-shipyard environment
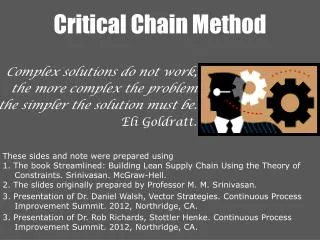
A Few Key Takeaways • CCPM is simple in concept—it turns common sense into common practice. • Introducing CCPM will help any project right away, regardless of how sophisticated and disciplined your project-management practices are (or aren’t). • Some “high-discipline” PM organizations take longer to realize CCPM benefits, because they have a harder time letting go of the “Old Rules.” • Many “low-discipline” PM organizations have an easier time adopting CCPM, because the “Old Rules” are not as deeply embedded.
Sample Results Sometimes Speed and Reliability Are Mission Critical. • 18 months vs. 60 months, • IT department first then drug development – CEO: “100% due date performance” • Warner Robbins – Iraq War – Expanded C-5 air lift capacity by 8 million ton-miles • Iraq War – One extra submarine in steaming days • Satellite Division – Turned around the business • Engine Division – partially funded Northwest acquisition • Software delivered 5 months early, 33% cost reduction