Download
1 / 17
180 likes | 395 Vues
Quick Review – p.254. 1. 2. 3. 4. Quick Review – p.254. 5. 6. 7. 8. Quick Review – p.254. 9. 10. Rectangular Approximation method (RAM). Section 5.1a. Solve the following:. A train moves along a track at a steady rate of 75mph from

E N D
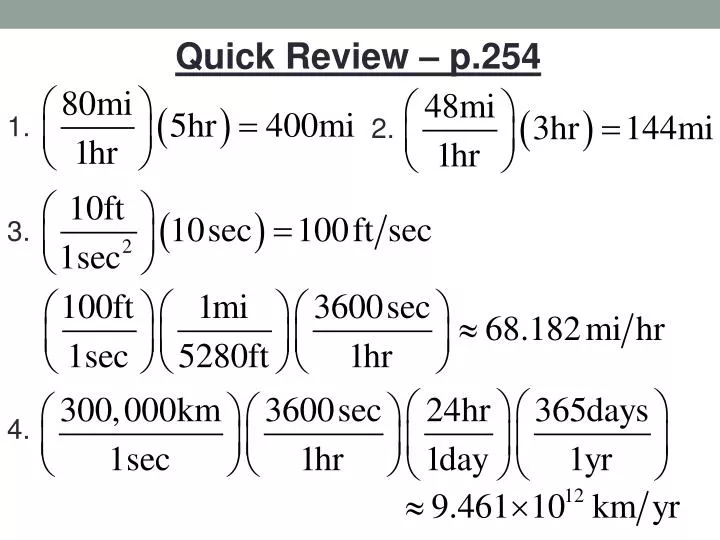
Quick Review – p.254 1. 2. 3. 4.
Quick Review – p.254 5. 6. 7. 8.
Quick Review – p.254 9. 10.
Rectangular Approximation method (RAM) Section 5.1a
Solve the following: A train moves along a track at a steady rate of 75mph from 7:00am to 9:00am. What is the total distance traveled by the train? Distance = Rate x Time Distance = (75 mph)(2 hr) = 150 miles Now, how does this result relate to the graph of the train’s velocity over time??? velocity (mph) It’s the area under the curve!!! 75 time (hr) 7 9
velocity (mph) It’s the area under the curve!!! 75 time (hr) 7 9 Would this same principle apply if the velocity varied over time? velocity Yes, but how could we find the area under this irregularly-shaped curve? Area = Distance time
velocity Yes, but how could we find the area under this irregularly-shaped curve? time The area could be found by slicing the region into small strips… …and then summing the area of the strips (which are essentially rectangles). The narrower the strips, the more accurate our estimate of area!!!
Our first example: A particle starts at x = 0 and moves along the x-axis with velocity v(t) = t for time t > 0. Where is the particle at t = 3? 2 Graph the velocity… v and partition the time interval [0, 3] into subintervals of length t (here, we’ll use 12 sub- intervals of length 3/12). 9 Zoom in on one of these sub- intervals and find the area: v t 0 1 2 3 We’ll approximate the area using the following rectangle: t 0 0.5 0.75 1
Our first example: A particle starts at x = 0 and moves along the x-axis with velocity v(t) = t for time t > 0. Where is the particle at t = 3? 2 Subinterval Midpoint Height = Area =
Our first example: A particle starts at x = 0 and moves along the x-axis with velocity v(t) = t for time t > 0. Where is the particle at t = 3? 2 Continue this pattern, sum the area for each of the 12 subintervals: We conclude that the particle has moved approximately 9 units in 3 seconds!!! (If it starts at x = 0, then it is very close to x = 9 when t = 3…)
Some new terminology… What we just used is called the Midpoint Rectangular Approximation Method (MRAM). (we evaluated the height of each rectangle at the midpoint of each subinterval) Evaluating the function at the left-hand endpoint yields the LRAM approximation, and right-hand endpoints gives the RRAM approximation for area.
Examples of each approximation, using the previous example, but only six subintervals: 3 3 3 LRAM MRAM RRAM A = 6.875 LRAM: A =
Examples of each approximation, using the previous example, but only six subintervals: 3 3 3 LRAM MRAM RRAM A = 6.875 A = 8.9375 MRAM: A =
Examples of each approximation, using the previous example, but only six subintervals: 3 3 3 LRAM MRAM RRAM A = 6.875 A = 8.9375 A = 11.375 RRAM: A =
Let’s use our calculators to evaluate the area for larger numbers of n subintervals… n LRAM MRAM RRAM n n n 6 6.875 8.9375 11.375 12 7.90625 8.984375 10.15625 24 8.4453125 8.99609375 9.5703125 48 8.720703125 8.999023438 9.283203125 100 8.86545 8.999775 9.13545 1000 8.9865045 8.99999775 9.0135045 For large values of n, we can see that all three sums approach the same number (in this case, 9).
Try another example: Estimate the area under the curve of the given function on the interval [0, 3]. First, look at a graph… Next, use a calculator to evaluate RAM values… n LRAM MRAM RRAM n n n 5 5.15480 5.89668 5.91685 10 5.52574 5.80685 5.90677 25 5.69079 5.78150 5.84320 50 5.73615 5.77788 5.81235 100 5.75701 5.77697 5.79511 1000 5.77476 5.77667 5.77857 All three converge!!! (at n = 1000 they agree for the first 3 digits!!!)
Try another example: Estimate the area under the curve of the given function on the interval [0, 3]. First, look at a graph… Next, use a calculator to evaluate RAM values… n LRAM MRAM RRAM n n n 5 5.15480 5.89668 5.91685 10 5.52574 5.80685 5.90677 25 5.69079 5.78150 5.84320 50 5.73615 5.77788 5.81235 100 5.75701 5.77697 5.79511 1000 5.77476 5.77667 5.77857 Note: the exact area is –7cos(3) + 6sin(3) – 2, which is 5.77666752456 to twelve digits…