Download
1 / 8
80 likes | 313 Vues
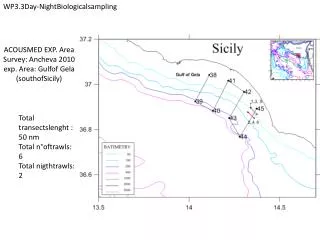
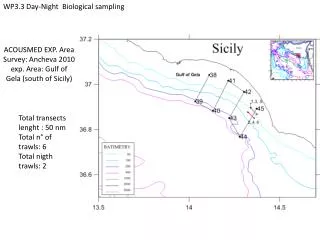
Acousmed Project. Optimization of Survey design by means of indicator geostatistic and Q(s) curves. Marco Barra, Gualtiero Basilone , Angelo Bonanno IAMC-CNR Capo Granitola. Study Area. Sampling period: 2002 - 2008 Month: June – July (October 2004) Surveyed area (NM 2 ): ≈ 2658

E N D
Acousmed Project Optimization of Survey design bymeansof indicator geostatistic and Q(s) curves Marco Barra, Gualtiero Basilone, Angelo Bonanno IAMC-CNR Capo Granitola
StudyArea • Sampling period: 2002 - 2008 • Month: June – July (October 2004) • Surveyed area (NM2): ≈ 2658 - 2239 NM2 parallel transect; -Max tr. length: 24 NM -Min tr length: 7 NM - 418 NM2 Zigzag. • Intertransect distance: 5 NM • Echo sounder: - Simrad EK500 (2002-2004) - Simrad EK60 (2005-2008) • Life stage: adults, juveniles (2004)
GeostatisticalAnalisys (Indicator) • Software used: RGeoS • Structural tools: Semivariance • Treshold selection criterion: • z such that Q(z) ≈ 80% of Q(0) • Analyzed dataset: • Parallel transect design: • Anchovy: ton/NM2 (2002-2008) • Sardine: ton/NM2 (2002-2008)