Download
1 / 6
60 likes | 132 Vues
Correlations: Relationship, Strength, & Direction. Scatterplots are used to plot correlational data It displays the extent that two variables are related to one another . Relationship Strength. The strength of a relationship between two variables is on a scale from -1 to 1

E N D
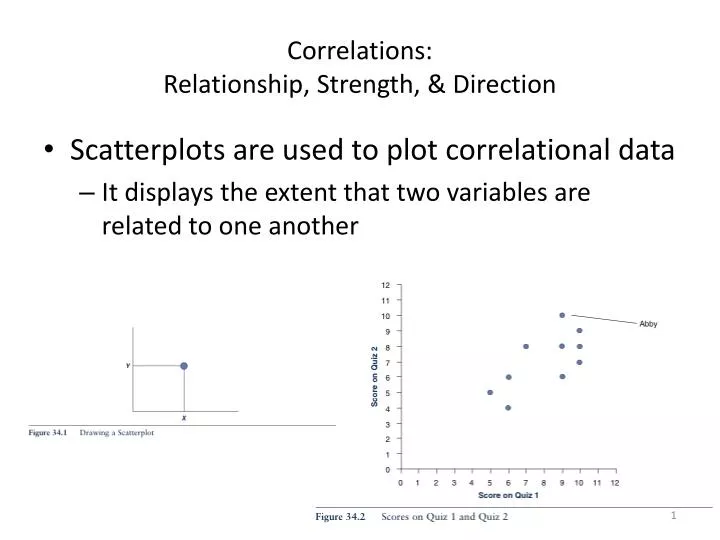
Correlations: Relationship, Strength, & Direction • Scatterplots are used to plot correlational data • It displays the extent that two variables are related to one another
Relationship Strength • The strength of a relationship between two variables is on a scale from -1 to 1 • Stronger relationships are closer to -1 or 1 • Weaker relationships are closer to 0
Linear and Nonlinear Relationships • Linear relationships are best described by a straight line
Nonlinear Relationships • Nonlinear relationships are best described by another type of curve
Outliers • Outliers are scores that are very different from the rest of the data • They can dramatically impact the relationship between two variables