Download
1 / 8
80 likes | 225 Vues
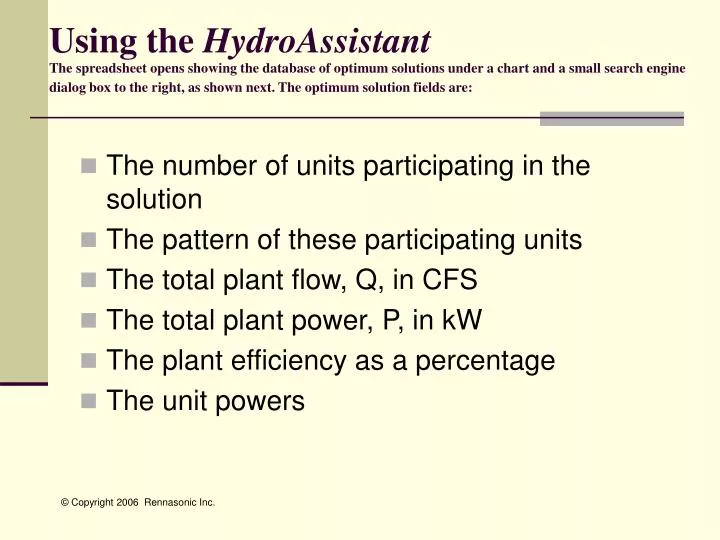
Using the HydroAssistant The spreadsheet opens showing the database of optimum solutions under a chart and a small search engine dialog box to the right, as shown next. The optimum solution fields are:. The number of units participating in the solution The pattern of these participating units

E N D
Using the HydroAssistantThe spreadsheet opens showing the database of optimum solutions under a chart and a small search engine dialog box to the right, as shown next. The optimum solution fields are: • The number of units participating in the solution • The pattern of these participating units • The total plant flow, Q, in CFS • The total plant power, P, in kW • The plant efficiency as a percentage • The unit powers
The database has been set up as an Excel auto-filter. Figure 1 provides a graphical illustration of the solutions database where both the plant performance and plant power are plotted as a function of flow. The auto-filter function allows easy sorting for other solutions Figure 1 – Plant optimizer tool
To use the search engine, type in the desired power (in kW) in the dialog box. In figure 2, we've typed in 14000. Then click the “Find Solutions” button. Notice that all of the units can be used for this search; individual units can be turned off if they are out of service. Figure 2 – entering a plant power
The screen (figure 3) now shows the results of this search as: Figure 3 represents the set of all optimum solutions that provide 14000 kW plant power, within plus or minus 5%. Each solution provides the power set points for each "on" unit in addition to the plant performance (efficiency) and total flow. These solutions are listed in order of best plant performance. Figure 3 - list of optimum solutions for plant power of 1400 kW
After using the search “reset button”, Figure 4 above has been updated to show all of the solutions. Either of the reset buttons restores the original chart and the solutions
If for instance, the desired plant power is 14,000 kW, and unit 4 is out of service, an optimum solution can be found by first pointing to unit 4 and clicking the mouse. This will remove unit 4 from service as shown on the right. The same required plant power can now be found without Unit 4 yielding: Notice all of the Plant Powers do not use Unit 4. Only combinations of units 1,2,3 and 5 are used.
If the plant is a “run of the river plant” or a certain amount of discharge is required, then a desired discharge can be entered into the dialog box as shown. Any individual unit can be removed from service as shown above. I like this application; wish I had one A Plant discharge of 3200 CFS was specified. As shown above in the plant power example, the optimum unit set-points are listed below.
Thank You For Your Time Please contact: Jim Walsh Rennasonic Inc 508 457 1215 sales@Rennasonic.com www.rennasonic.com