Download
1 / 84
870 likes | 1.09k Vues
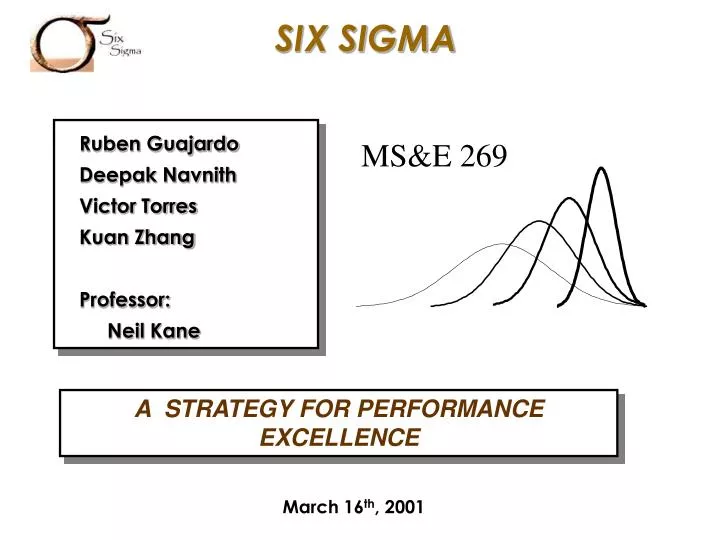
Ruben Guajardo Deepak Navnith Victor Torres Kuan Zhang Professor: Neil Kane. MS&E 269. A STRATEGY FOR PERFORMANCE EXCELLENCE. March 16 th , 2001. But what could happen at a quality level of 99.9% (i.e., 1000 ppm),. in our everyday lives (about. •.

E N D
Ruben Guajardo Deepak Navnith Victor Torres Kuan Zhang Professor: Neil Kane MS&E 269 A STRATEGY FOR PERFORMANCE EXCELLENCE March 16th, 2001
But what could happen at a quality level of 99.9% (i.e., 1000 ppm), in our everyday lives (about • 4000 wrong medical prescriptions each year • More than 3000 newborns accidentally falling from the hands of nurses or doctors each year • Two long or short landings at American airports each day • 400 letters per hour which never arrive at their destination How good is good enough? 99.9% is already VERY GOOD 4.6)?
How can we get these results • 13 wrong drug prescriptions per year • 10 newborn babies dropped by doctors/nurses per year • Two short or long landings per year in all the airports in the U.S. • One lost article of mail per hour
The answer is: Six Sigma
What is Six Sigma • A Vision and Philosophical commitment to our consumers to offer the highest quality, lowest cost products • A Metric that demonstrates quality levels at 99.9997% performance for products and processs • A Benchmark of our product and process capability for comparison to ‘best in class’ • A practical application of statistical Tools and Methods to help us measure, analyze, improve, and control our process
Six Sigma as a Philosophy s is a measure of how much variation exists in a process Internal & External Failure Costs Prevention & Appraisal Costs Old Belief High Quality = High Cost Costs Old Belief 4s Quality Internal & External Failure Costs Prevention & Appraisal Costs New Belief High Quality = Low Cost Costs 4s New Belief 5s 6s Quality Better Processes Reduce Cost
Focus: The End User • Customer: Internal or External • Consumer: The End User the “Voice of the Consumer” (Consumer Cue) must be translated into the “Voice of the Engineer” (Technical Requirement) Q F D
1 2 3 5 6 7 0 4 -7 -6 -5 -4 -3 -2 -1 Six Sigma as a Metric CENSORED = Sigma = = Deviation ( Square root of variance ) Axis graduated in Sigma between + / - 1 68.27 % result: 317300 ppm outside (deviation) between + / - 2 45500 ppm 95.45 % between + / - 3 99.73 % 2700 ppm between + / - 4 63 ppm 99.9937 % between + / - 5 0.57 ppm 99.999943 % between + / - 6 99.9999998 % 0.002 ppm
Non-Liner Decrease s PPM 308,537 66,811 6,210 233 3.4 2 3 4 5 6 Process Capability Defects per Million Opportunities * Includes 1.5s shift Focusing on s requires thorough process understanding and breakthrough thinking
Six Sigma as a Tool Many familiar quality tools applied in a structured methodology
Six Sigma as a Method Y= f (x) To get results, should we focus our behavior on the Y or X
A Traditional View Market Share Sales Growth • Output Variables Profitability Manage the outputs.
A Non-Traditional View Product Quality Service COQ • Input Variables On-Time Delivery Relationships Credit Terms Customer Training Customer Satisfaction Market Share Sales Growth • Output Variables Profitability Manage the inputs; respond to the outputs.
Distinguish “Vital Few”from “Trivial Many” Environment Material Measurements Process (Parameters) Methods Output Machine People Define the Problem / Defect Statement Y = f ( x1*, x2, x3, x4*, x5. . . Xn) Y = Dependent Variable Output, Defect x = Independent Variables Potential Cause x* = Independent Variable Critical Cause
Measure Control Analyze Improve Measure Control Analyze Improve Measure Control Analyze Improve Measure Control Analyze Improve Measure Strategy by Phase - Control Analyze Improvement Phase Measure (What) Analyze (Where, When, Why) Improve (How) Control (Sustain, Leverage) • Step • What is the frequency of Defects? • Define the defect • Define performance standards • Validate measurement system • Establish capability metric • Where, when and why do Defects occur? • Identify sources of variation • Determine the critical process parameters • How can we improve the process? • Screen potential causes • Discover relationships • Establish operating tolerances • Were the improvements effective? • Re-establish capability metric • How can we maintain the improvements? • Implement process control mechanisms • Leverage project learning's • Document & Proceduralize Focus Y Y Y Y X Vital X X Vital X Vital X Y, Vital X Y, Vital X Process Characterization Process Optimization
A Black Belt has…, and will… Statistical, Quality Skill The new of Six Sigma Mentoring Interpersonal Skill Leadership Driving the Use
Corporate Commitment Motorola is committed to developing these leaders… We provide these people with extensive training in statistical and interpersonal tools, skilled guidance and management support… Once their development has achieved a level worthy of recognition, we even have a term for those exceptional individuals : Six Sigma Black Belts Chris Galvin
Corporate Commitment (Cont’d) • Motto: • Quality is our job • Customer satisfaction is our duty • Customer loyalty is our future
SIGMA 100.00 5.3 5.4 5.5 5.6 5.65 DPMOp 10.00 6 Sigma 6 MY95 MY96 MY97 MY98 1.00 J96 J97 J95 J94 Barrier Breakthrough Plan Pareto, Brainstorming, C&E, BvC 8D, 7D, TCS Teams, SPC DOE, DFM, PC RenewBlack Belt Program (Internal Motorola) Black Belt Program (External Suppliers) Proliferation of Master Black Belts
Other Companies have Black Belts Program • GE has very successfully instituted this program • 4,000 trained Black Belts by YE 1997 • 10,000 trained Black Belts by YE 2000 • “You haven’t much future at GE unless they are selected to become Black Belts” - Jack Welch • Kodak has instituted this program • CEO and COO driven process • Training includes both written and oral exams • Minimum requirements: a college education, basic statistics, presentation skills, computer skills • Other companies include: • Allied Signal -Texas Instruments • IBM - ABB • Navistar - Citibank
Measure Characterize Process Evaluate Control Understand Process Maintain New Process Improve Improve and Verify Process
Measure Phase Understand Process Collect Data Define Problem Process Performance • Defect Statement • Project Goals • Define Process- Process Mapping • Historical Performance • Brainstorm Potential Defect Causes • Data Types - Defectives - Defects - Continuous • Measurement Systems Evaluation (MSE) • Process Capability - Cp/Cpk - Run Charts • Understand Problem (Control or Capability) Understand the Process and Potential Impact
Problem Definition • What do you want to improve? • What is your ‘Y’? Reduce Complaints (int./ext.) Reduce Cost Reduce Defects What are the Goals? Problem Definitions need to be based on quantitative facts supported by analytical data.
Baselining: • Quantifying the goodness (or badness!) of the current process, before ANY improvements are made, using sample data. The key to baselining is collecting representative sample data • Sampling Plan • - Size of Subgroups • - Number of Subgroups • Take as many “X” as possible into consideration
How do we know our process? Process Map Fishbone Time Historical Data
RATIONAL SUBGROUPS Minimize variation within subroups Maximize variation between subrgoups BLACK NOISE (Signal) WHITE NOISE (Common Cause Variation) PROCESS RESPONSE TIME RATIONAL SUBROUPING Allows samples to be taken that include only white noise, within the samples. Black noise occurs between the samples.
Visualizing the Causes Within Group Time 1 Time 2 Time 3 Time 4 • Called s short term (sst) • Our potential – the best we can be • The s reported by all 6 sigma companies • The trivial many sst + sshift = stotal
Visualizing the Causes Time 1 Time 2 Time 3 Time 4 • Called sshift (truly a measurement in sigmas of how far the mean has shifted) • Indicates our process control • The vital few sst + sshift = stotal Between Groups
Assignable Cause • Outside influences • Black noise • Potentially controllable • How the process is actually performing over time Fishbone
Common Cause Variation • Variation present in every process • Not controllable • The best the process can be within the present technology Data within subgroups (Z.st) will contain only Common Cause Variation
R&R Part-Part Gauge R&R s2Total = s2Part-Part + s2R&R Recommendation: Resolution £ 10% of tolerance to measure Gauge R&R £ 20% of tolerance to measure • Repeatability (Equipment variation) • Variation observed with one measurement device when used several times by one operator while measuring the identical characteristic on the same part. • Reproducibility (Appraised variation) • Variation Obtained from different operators using the same device when measuring the identical characteristic on the same part. • Stability or Drift • Total variation in the measurement obtained with a measurement obtained on the same master or reference value when measuring the same characteristic, over an extending time period.
Map the Process Identify the variables - ‘x’ Measure the Process Understand the Problem - ’Y’ = function of variables -’x’ Y=f(x) To understand where you want to be, you need to know how to get there.v
Measure Characterize Process Evaluate Control Understand Process Maintain New Process Improve Improve and Verify Process
In many cases, the data sample can be transformed so that it is approximately normal. For example, square roots, logarithms, and reciprocals often take a positively skewed distribution and convert it to something close to a bell-shaped curve
What do we Need? LSL USL LSL USL On Target High Variation High Potential Defects No so good Cp and Cpk Off-Target, Low Variation High Potential Defects Good Cp but Bad Cpk LSL USL • Variation reduction and process centering create processes with less potential for defects. • The concept of defect reduction applies to ALL processes (not just manufacturing) On-Target, Low Variation Low Potential Defects Good Cp and Cpk
Eliminate “Trivial Many” • Qualitative Evaluation • Technical Expertise • Graphical Methods • Screening Design of Experiments Identify “Vital Few” • Pareto Analysis • Hypothesis Testing • Regression • Design of Experiments Quantify Opportunity • % Reduction in Variation • Cost/ Benefit Our Goal: Identify the Key Factors (x’s)
DBP 109 104 99 94 Day Graph>Box plot Graph>Box plot Without X values 75% DBP DBP 109 104 99 94 109 104 99 94 50% DBP 25% Operator 109 104 99 94 Shift Box plots help to see the data distribution
Statistical Analysis Apply statistics to validate actions & improvements Hypothesis Testing Compare Sample Means & Variances VS Regression Analysis • Is the factor really important? • Do we understand the impact for the factor? • Has our improvement made an impact • What is the true impact? Identify Relationships Establish Limits
poor A B 2.5 2.0 1.5 1.0 0.5 CONTROL D C Z shift 1 2 3 4 5 6 good poor good TECHNOLOGY • St A- Poor Control, Poor Process B- Must control the Process better, Technology is fine C- Process control is good, bad Process or technology D- World Class
M.A.D Six Sigma Design Process Stop Adjust process & design Technical Requirement Con-sumer Cue Identify Critical Process Preliminary Drawing/Database Obtain Data on Similar Process Calculate Z values Rev 0 Drawings Identity CTQs Stop Fix process & design 1st piece inspection Z<3 Prepilot Data Recheck ‘Z’ levels Obtain data Z>= Design Intent M.A.I.C Pilot data
QFD, FMEA, RTY • #1 Define the customer Cue and technical requirement we need to satisfy • Consumer Cue: Blocks Cannot rattle and must not interfere with box • Technical Requirement: There must be a positive Gap