Download
1 / 41

E N D
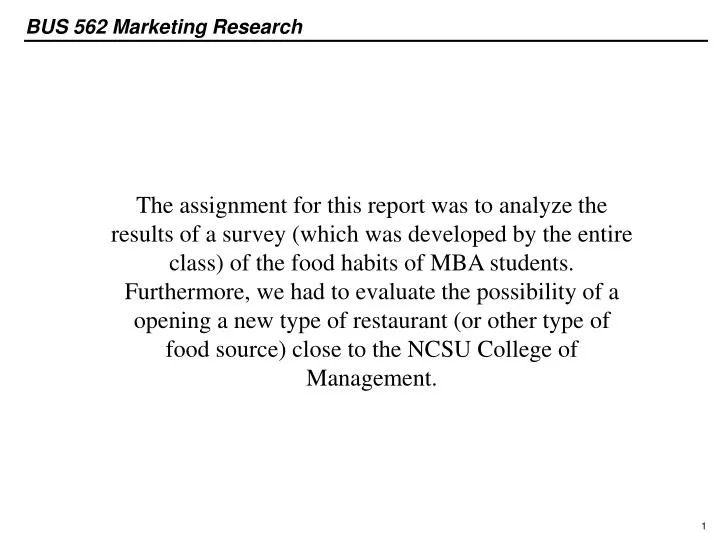
The assignment for this report was to analyze the results of a survey (which was developed by the entire class) of the food habits of MBA students. Furthermore, we had to evaluate the possibility of a opening a new type of restaurant (or other type of food source) close to the NCSU College of Management.
Analysis of Preferences, Habits and Alterative Food Sources for North Carolina State University Evening MBA Students BUS 562 Seth Palmer Denise Spath Dan Wolf
Table of Contents Executive Summary . . . . 3 Introduction/Background . . . 4 Map of Food Establishments . . 5 Research Method . . . . 6 Objectives and Hypotheses . . . 7 Descriptive Interpretations . . . 8 Purchase Habits . . . 9 MBA Student Profile . . . 12 What are MBA Students Likely to Patronize? . 14 Correlations . . . 15 Understanding Basic Needs . . 16 Factor Details . . . 17 Factor Analysis Table . . . 18 Quantitative Issues . . . . 20 Linear Regression Tables . . 21 What are Spending Habits? . . 22 Market Size . . . 23 Total Spending . . . 24 Purchase Frequency . . . 25 Average Purchase Amount . . 26 Reliability Analysis . . . 27 Hypotheses Results . . . . 28 Conclusions/Recommendations . . . 29 Limitations . . . . 30 Topics for Further Investigation . . . 31 Appendix . . . . . 32 Evaluation of Alternatives (Pros and Cons) . 33 Data Cleaning Procedure . . 34 Survey . . . . 35
Executive Summary Research Objectives Summary Of Findings • High Degree Of Dissatisfaction • Two Distinct Groups In MBA Program - Snackers and The Health Conscience • Two Of Three Alternative Options Positively Perceived • Evening MBA Food Market Is $1100/wk • Understand Food Purchase Preferences And Habits Of Evening MBA Students • Discover The Demand For Food • Evaluate Preferences Of Three Food Alternatives Overall Satisfaction • 48% Not Happy Method Overview • Started With Focus Group To Uncover Issues • Designed 17 Question Survey To Quantify Issues • Received 66 Out Of 220 MBAs (Census Sample) Survey Uncovered Dissatisfaction, Provided Guidance For Improvement And Quantified Market Size
Introduction Situation Call To Action! • Dr. Zahay Was Amazed To Find Students Unaware Of University Towers Cafeteria • Apply Marketing Research Tools To Quantify Preferences, Habits And Opinions • Lay Groundwork For Potential Improvements For Food Options • In-class Focus Group Uncovered: • BUS 562 MBA Students Too Busy To Eat Arrive “JIT” • Eat Snacks • Many Eat After They Get Home • Not Satisfied With Current Food Options • Felt Most Other MBA’s Behaved In The Same Way • BUS 562 May Not Be Representative Need Survey To Verify And Quantify Tackled A Real World Problem To Learn Marketing Research Tools
Introduction Food Establishments within Walking Distance of Nelson Hall East Village: American cuisine, $5-8 dinners, eat-in PizzAmerica: Italian, $6-8 dinners, eat-in, take out Subway: Sandwiches, $3-6, eat-in, take out WolfMart: Snacks Sakura Express: Japanese, $5-6 dinners, eat-in or take-out v v v College of Management (Nelson Hall): 2 soda machines and 1 candy/chips machine University Towers: Cafeteria, $5-6 per dinner 200 Feet http://www.ncsu.edu/campus_map/north.htm Seven Options Within 400 Feet Of Nelson Hall
Research Method Exploratory • Exploratory: Focus Group (Qualitative) • Survey Method Chosen As Research Tool • Need To Answer Who, What, Where, When And How About The Target Population • Data Must Allow For Identifying Relationships, Establishing The Existence Of Differences, And Verifying Validity Of Relationships • Desire To Collect Substantial Amounts Of Measurable Information From Population • Low Distribution Cost Survey Design Survey Procedures • Survey Design • 17 Questions Developed In Class • Answer Key Questions • What Is The Potential Market Size? • What Drives Satisfaction? • What Are Frequency and Dollar Spending Patterns? • Evaluate Alternatives Analysis • Survey Procedure • E-Mailed To All 220 MBA Students on 4/7/2003 • Responses Collected From 4/7/2003-4/21/2003 • Offered $50 Gift Certificates As Incentives • Generated 30% Response Rate (66/220) Conclusions and Recommendations • Analysis (Quantitative) • Cleaned Data • Simple Descriptive Statistics, Factor Analysis • Answer Key Questions Using Anova, Cluster and Regression Used Structured Disciplined Approach To Solve A Real World Problem
Objectives and Hypothesis Hypotheses Research Objectives • Understand Food Purchase Preferences And Habits Of Evening MBA Students • Estimate Market Demand • Evaluate Three Alternative Food Choices • Students Are Generally Dissatisfied With Current Options • Students Likely To Frequent University Towers And Nelson Express • Time Is A Prohibitive Factor • Part Time Students Will Spend More And Will Be More Likely To Frequent One Of The Three Alternatives Than Full Time Students • Everyone Eats Something Before Class • Snacking Is A Major Component Of Food Options • University Towers: Full Service Cafeteria • Expanded Nelson Hall Vending Machines: Prepackaged Microwave-able Items • Nelson Express: Kiosk In Nelson Hall (Deli Sandwiches, Hot Dogs, Snacks, Fresh Fruit) Marketing Research Process Will Address Research Objectives And Test Hypotheses
Descriptive Interpretations Overall Satisfaction • 48% Not Happy 48% Of Students Not Satisfied With Current Food Options
Purchase Habits # Of Purchases Per Week • 85% Buy At Least Once A Week % Purchases Per Class Per Week • 65% Buy Every Class Most Students Making Purchases Before Class
Purchase Habits Food Type Preferences • Most Prefer Mexican, American and Chinese Food Provider Market Share By Satisfaction Level • How To Read: Of The Very Satisfied People, 10% Visit WolfMart • Dissatisfied People Visit Subway • Satisfied People Visit “Other” and East Village • WolfMart Has Largest Market Share At 33% Of All Purchases Market Share – Of Visits By Satisfaction Level WolfMart Leads The Pack With 33% Food Purchases (# Basis)
Purchase Habits Students Buying Lots Of Snacks… Avg Purchase Amount • Snack Providers Dominate • 58% of Purchases <=$4.00 … Because They Don’t Have Time Arrival Time • 38% Arrive Within 15 Minutes of Class
MBA Student Profile MBA Student Demographics • 70% Part Time Students • 70% Work Full Time • 67% Male • Average Age 31 Years • 75% Have Two Classes Per Week • “Average Student” Is 31 years Old Male, Employed, Part Time Student • Closely Matches Published Profile • Implies Survey Responders Representative Of MBA’s … And Many Important Factors MBA Students Have Strong Feelings… % Ext. Imp., Important % Not Important % Strongly Agree, Agree % Strongly Disagree, Disagree • Sanitation 86% 0% • Speed 85% 0% • Taste 81% 2% • Parking 70% 2% • Close to Nelson Hall 71% 3% • Take Out 68% 8% • Variety 41% 2% • Atmosphere 30% 8% • Decor 7% 31% • TV 9% 64% • Feel Rushed Before Class 65% 11% • Prefer Nutritious Meal 52% 11% • Usually Have Chips and Soda 26% 40% • Eat From Vending Machines 26% 47% • Like FF Combo Meals 18% 52% • Late for class 9% 59% • Want To Eat Right and (Say) They Want To Avoid Fast Food • Demanding Crowd… But Speed and Convenience Dominate
MBA Student Profile Observations – Supported By Anova Analysis • Bus562 Class vs. All MBA’s • BUS 562 Class 40% “Strong Snackers” VS. 20% Of MBA Population • Arrival Time • The Longer You’ve Been In Program The Later You Arrive • Health Conscience Arrive Later • Part Times Arrive Later • Gender • Females Take Fewer Classes (2 For Males Vs 1.75 Females) • Males Are More Snack Oriented, Females More Health Conscience • Females More Concerned With Speed/Convenience Than Males • No Differences In Spending Amount Freq Or Locations • Full vs Part Time • Part Times Spend Less Than Full Timers Lack Of Differences Among Demographics Interesting
What Are MBA Student’s Likely To Patronize? University Towers: Cafeteria • Not Likely (11% Likely +) Expanded Nelson Hall Vending Machines • Somewhat Likely (27% Likely+) Nelson Express: Food Kiosk • Most Likely (62% Likely+) Nelson Express Had Most Positive Response
Correlations Significant Correlations Correlation Coefficient • Employment Status (1= Full Time 2 = Part Time • Arrival Time 1=Early, 5=Later) • Avg Amount • Avg Num Of Purchases • Student Status (1=Part Time, 2=Full Time) • Employment Status (1=Full Time, 2 Part Time) • East Village Visits • Avg Number Of Classes -0.81 0.52 -0.55 -0.51 Very Few Significant Relationships (Correlation Coefficient)
Understanding Basic Needs • Factor Analysis Is Data Reduction Tool That Finds Commonalities In Data Two Food Attitude Factors Three Restaurant Characteristics Factors % Of Students % Of Students • Fast Food Junkies ~25-30% • Health Conscience ~50-60% • Dining Experience ~20-30% • Speed/Convenience ~70-80% • Food Quality ~50-70% • Explain 28% of Variance • Explain 54% of Variance Factor Analysis Reduced 32 Individual Questions To Five Factors
Factor Details • Fast Food Junkies Tend To Be: • Dining Experience • Eat Fast Food • Feel Rushed Before Class • Buy From Vending Machines • Buy Soda And Chips • 562 has 2.5x more FF Junkies than average • Dish Presentation • Decor • Atmosphere • Speed/Convenient • Close to Nelson Hall • Take-Out • Good Parking • Health Conscience Tend To Be • Eat Nutritious Balanced Meals • Pay More For Healthy Food • Food Quality: • Taste • Variety Factors Not Surprising
Factor Analysis Table • Factor Analysis On Important Restaurant Characteristics Found Three Factors • “Other” Does Not Explain Significant Variance And Is Difficult to Interpret “Dining Experience” “Speed/Convenience” “Food Quality” 2 Missing Values Replaced with question mean value MBA’s Concerned With Dining Experience, Speed/Convenience and Food Quality
Factor Analysis Table • Factor Analysis On Food Attitudes Found Two Significant Factors • “Others” Do Not Explain Significant Variance and Are Difficult to Interpret “Snackers” “Health Conscience” 9 Missing Values Replaced With Question Mean Value MBA Program Made Up Of Snackers and Health Conscience
Quantitative Issues Overall Satisfaction • 48% Not Happy • What Drives Current Satisfaction Level? • Linear Regression On Overall Satisfaction: Likelihood To Use Nelson Express Age Arrival Time Later You Arrive The Happier You Are Concept Satisfies The Dissatisfied Younger Are Happier Arrival Time Drives Overall Satisfaction
Linear Regression Tables What Drives Satisfaction? • Also Tried Logistic Regression On Satisfaction. Response Defined As Values 1 Ad 2 (Strongly Agree, Agree) Of Satisfaction Question. Non Response Defined As Values 3, 4 And 5. • Same Results As Above • Tried Logistic On Dissatisfaction With Same Results As Above Model Explains 25% of Variance
What Are Spending Habits? Goal: Find Buying Habit Segments Elite Diners Cheap Diners • Used Average Expenditure and the Prob of Purchasing A Snack Before Class (Q8/Q6) • Found Four Identifiable Segments Snackers Indifferent Snackers Indifferent Cheap Diners Elite Diners Avg Purchase: Purchase Freq: Avg. Sat (Low=Good): Market Share: Low Low 2.6 13% Low High 3.9 44% Moderate High 3.2 32% High High 3.2 11% 76% of Market Are Snackers and Cheap Diners
Market Size Goal: Determine Market Size and Understand Drivers of Consumption • Market Size: Average Spending X Frequency Of Purchase = Total Spending/Week X 220 MBA Students = Market Size/Week $3.34 1.5/week $5.01 220 $1102 • What Drives Total Spending, Average Purchase Amount and Frequency Of Purchase? • What’s Interesting Is What’s Not Here: • Demographics • Attitudes • Spending habits • Restaurant Characteristics • Number of Classes (Q6) • How Many Times You Buy (Q8) • Correlation Coefficient = .66 Demographics Not Driving Spending Habits
Total Spending What Drives Total Spending? (Details) • On the Margin, Question 16 Does Not Explain Much Variance Model Explains 99% of Variance In Total Spending
Purchase Frequency What Drives Purchase Frequency? (Details) Model Explains 99% of Purchase Frequency Variance
Average Purchase Amount What Drives Average Purchase Amount? (Details) Model Explains 46% of Average Purchase Amount
Reliability Analysis • Reliability Analysis Is Used To Assess Reliability of Using Multiple Questions To Create A Scale Reliability Analysis – Attitude Questions Reliability Analysis – Restaurant Characteristics • Alpha = .66 • Statistically Significant • F Test • Alpha = .62 • Statistically Significant F test Questions 12 and 14 Can Be Reliably Used to Create Scales
Hypotheses Results Hypothesis Result • Students Are Generally Dissatisfied With Current Options • Students Likely To Frequent University Towers And Nelson Express • Time Is A Prohibitive Factor • Part Time Students Will Spend More And Will Be More Likely To Frequent One Of The Three Alternatives • Everyone Eats Something Before Class • Snacking Is A Major Component Of Food Options • True • More Likely to Frequent Nelson Express, Less Likely to Frequent University Towers • True • False, Part Time Spend More And They Are No More Likely To Freq One Of The Three Alternatives • True • True All Conclusions Supported With ANOVA Analysis Most Hypotheses Turned Out To Be True
Conclusions/Recommendations • MBA Students Dissatisfied, Something Should Be Done • Nelson Express And Expanded Vending Are Preferred Alternatives • MBA Evening Market Size ~ $1100 /Week • Survey Suggests MBA Evening Solution Should: • Be Viable On A Percentage of $1100/Week • Address Health Conscience And Junkies Needs • Recognize Most People Spending $3-$5 • Fast and Convenient • Expanded Vending Seems Most Viable • UT Not Viable • Nelson Express – MBA Evening Market Not Big Enough… But Adding Prof., MAC, Econ, and Undergrads Could Help Justify • Next Steps: • Share Findings With MBA Office • Generate Specific Proposals • Think Through Pros And Cons of Options • Balance Student Needs Within University Constraints Survey Uncovered Dissatisfaction, Provided Guidance For Improvement And Quantified Market Size
Limitations • Nonsystematic (Sampling) Error: • 30% Response Rate (66/220) May Cause Invalid Findings • Census Is Ideal For Populations Under 500 • Respondents Were Self Selected, Which May Introduce Bias • Disadvantages of Survey Method: • Response Rates Lower Than Face-to-face Interviews • Inaccuracies In Construct Development, Scale Measurements, And Questionnaire • Limited Use Of Probing Questions • Intentions And Behaviors Are Often Different • Systematic (Nonsampling) Error: • Q10-1 To Q10-8 • Missing Responses Greater Than 5% • Obvious Misunderstanding Of Instructions • Missing Responses Are Most Likely “Zero” Visits • Q14-13: Misunderstanding Of Instructions 68% Did Not Answer This Question Low Response Rate May Introduce Bias
Further Investigation • Topics for Further Study • Survey students in other curriculums, e.g., engineering, textiles, education, etc., who may be taking • MBA classes to determine if they have similar views on purchasing food before evening classes • Survey only full-time MBA students to determine if they have concerns about the availability or variety of food during lunch hours • Survey professors, MAC, Econ and Undergraduates of the College of Management to determine if they have concerns about the availability or variety of food available within walking distance of Nelson Hall during lunch and dinner hours. • Survey nearby buildings such as Kilgore, Scott, or Bostian Halls to see if other students and/or professors have concerns about lunch or evening meals (please see slide 5 for a map of nearby buildings) • Conduct a survey to determine if there would be demand for meals or snacks from the NCSU food court during evening hours (it is within walking distance from Nelson Hall but closes at 3:30 pm) Professors And Students From Other Disciplines Located Close To Nelson Hall Could Be Surveyed To See If They Have Similar Food Preferences. The Discovery Of Additional Segments May Lessen The Risk Of Opening A New Food Venture In Or Near Nelson Hall
Evaluating Alternatives Nelson Express Expanded Vending Pros: Cons: Pros: Cons: • Space Issues • Zoning • Mess Factor • Limited Availability • Financial Risk • May Be Out of Price Range • Available 24x7 • Fits Price Range • Minimal Financial Risk To University • Meets “Rushed” • Space Issues • Zoning (?) • Mess Factor • Would Not Be Perceived as Healthy • 62% Likely To Use • Better able to Offer Fresh Food Survey Is First Step In A Long Process To Address This Issue
Data Cleaning Rationale What We Did • 19 Attitude Questions (Q12_1 to Q12_19) • One Missing Data in Factor Analysis Wipes Out the Entire Row of Data – Avoided Losing 10% of the Responders. • Missing 9 Values On 7 Different Responders • Filled in with Average Value • Restaurant Characteristics Question Q14_13 • One Missing Data in Factor Analysis Wipes Out the Entire Row of Data – Avoided Losing 10% of the Responders. • 46 Missing Values • Threw Question Out • One Missing Data in Factor Analysis Wipes Out the Entire Row of Data – Avoided Losing 13% of the Responders. • 12 Restaurant Characteristics Questions (Q14_1 to Q14_12) • Missing 2 Value On 2 Different Responders • Filled in with Average Value • 8 Frequency Of Visiting Restaurants Questions (Q10_1 to Q10_8) • Assumed Missing Meant 0 Visits • 60 Missing Values on 15 Different Responders Special Coding of Missing Values Allowed for Customized Treatment
Survey Would you like a chance to win a $50 gift certificate to PF Chang’s China Bistro? Dear NC State M.B.A. Student: The students of BUS 562 (Marketing Research) are asking for your help. As part of their joint class project, we have decided to conduct a survey of the eating habits before classes of the students who have evening classes in Nelson Hall. We intend to present our results to fulfill our class requirements and also share them with the M.B.A. office. The questionnaire should take only 5-10 minutes to complete. All responses will be analyzed in aggregate and no individual response will be identified. Only aggregate reports will be shared with the M.B.A. office and all individual responses will remain strictly confidential. Please print out the questionnaire and fill it out by hand. When you have finished the survey, please return the survey to any of your evening or day professors. They will have a special envelope for the surveys to be returned to us. If you have any questions while completing the survey, please contact Glen Ridout at glenandveni@aol.com Thanks in advance for your help. We need your response before April 15. Sincerely yours, Spring '03 M.B.A. 562 class Only complete surveys that are turned in to your professor by April 15 will be eligible for the drawing. We will be giving away 2 gift certificates! Please be sure to include Name/Email so you may be contacted if you are one of the winners! Name: ________________________ E-Mail Address:_________________________
Survey (continued) First, please provide us with some background information: 1) What is your student status? □ Part-time □ Full-time □ I am not currently taking classes. 2) In which year of the MBA program are you? □ Year 1 □ Year 2 □ Year 3 □ Greater than 3 Years 3) Are you currently employed and what is your status? □ I work part-time □ I work full-time □ I am not working at this time 4) What is your gender? □ Male □ Female 5) What is your age? □ < 21 years □ 21-25 □ 26-30 □ 31-35 □ 36-40 □ 41-45 □ 46-50 □ > 50 6)How many 6:00 PM Classes do you have per week? □ 0 □ 1 □ 2 □ 3 □ 4 7) What time do you usually arrive for your 6:00pm class in Nelson Hall? Before 5:00 ___ 5:00 to 5:15 ___ 5:15 to 5:30 ___ 5:30 to 5:45 ___ 5:45 to 6:00 ___ 8) On average, how many times per week do you have a meal or snack before your evening class? □ 0 day per week □ 1 days per week □ 2 days per week □ 3 days per week □ 4 days per week □ More than 4 days per week
Survey (continued) • 9) How much do you spend, on average, for meals/snacks on nights you have class? • Please place “X”. • $0 $1 $2 $3 $4 $5 $6 $7 >$7 • 10) Please indicate the number of times you have made purchases from the following establishments within walking distance of Nelson during the past month: • Zero One Two Three More than Three • Wolfmart • Subway • Pizza America • East Village • University Towers • Nelson Vending Machines • Sakura Express • Other • Indicate the extent to which you agree with this statement: • I am generally satisfied with the choices of restaurants/snack food available within walking distance of Nelson. (circle one) • 1 = Strongly Agree 2=Agree 3 = Neutral 4=Disagree 5 = Strongly Disagree
Survey (continued) 12) On a scale of 1 to 5, with 1 = Strongly Agree, 2 = Agree 3 = Somewhat Agree, 4= Somewhat Disagree, 5 =Disagree 6=Strongly Disagree , please check the number that best expresses the extent to which you agree or disagree with each of the following statements.
Survey (continued) 13) What kind of cuisine do you enjoy the most? (Check Only One) □ Fast Food □ American (Family Restaurant) □ Chinese □ Japanese □ Mexican □ Italian □ Other (Specify) ___________________________________ 14) How would you rate the following restaurant characteristics in determining your choice before class? Using a scale of 1 (Extremely important) to 5 (not at all important. Please Check.
Survey (continued) 15) How likely are you to use Expanded Vending machines in Nelson? (vending machines containing microwave-ready prepackaged vending items and a microwave oven.) Please circle one. 1 = Very Likely 2=Likely 3=Somewhat Likely 4=Somewhat Unlikely 5=Unlikely 6=Very Unlikely 16) How likely are you to visit University Towers Cafeteria, located across the street from Nelson Hall? For a reasonable price you can purchase a meal card or an individual meal with choices including a salad bar, sandwich line, and several hot meal selections. They serve dinner between 4PM and 7:30PM. Please circle one. 1 = Very Likely 2=Likely 3=Somewhat Likely 4=Somewhat Unlikely 5=Unlikely 6=Very Unlikely 17) How likely are you to purchase deli sandwiches, hotdogs, snacks, and fresh fruit available at a food stand located in Nelson Hall? Please circle one. 1 = Very Likely 2=Likely 3=Somewhat Likely 4=Somewhat Unlikely 5=Unlikely 6=Very Unlikely Please add any additional comments you may have: Thank you again for taking the time to complete this survey!