Download
1 / 17
170 likes | 333 Vues
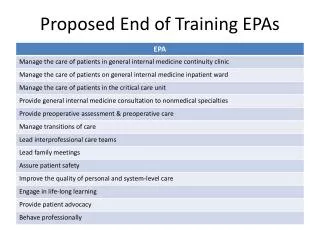
Project EPAS. School Report Data. Student score report Student roster Early intervention roster Profile summary report Presentation packet. Student report Student score report label High school list report Early intervention rosters Using Your PLAN Results Profile summary report

E N D
Project EPAS School Report Data
Student score report Student roster Early intervention roster Profile summary report Presentation packet Student report Student score report label High school list report Early intervention rosters Using Your PLAN Results Profile summary report Presentation packet Standard Reporting EXPLORE PLAN
Analyzing and Interpreting School Report Data • Objectives • To examine and interpret school data as presented in the Presentation Packet • To discuss the implications of data analysis • To examine and interpret school data presented in the Profile Summary Report • To examine EXPLORE and PLAN test score correlations to LEAP 21 and GEE 21 • To graph EXPLORE and PLAN mean scores and discuss implications for instruction
How does our students’ performance compare with that of students in the national norm group? Implications School Data: Presentation Packet
2. Is the academic achievement of our students improving? Implications School Data: Presentation Packet
3. How are our students planning for their academic future? Implications School Data: Presentation Packet
4. Is there a certain demographic or gender group in your school or district with exceptional gains or losses in EXPLORE or PLAN scores? Implications School Data: Presentation Packet
5. What are students’ career preferences? Implications School Data: Presentation Packet
6. In what areas are students reporting the need for help? Implications School Data: Presentation Packet
School Data: Profile Summary Report • How are the data in Table 1a presented differently from the data presented in Chart 1 in the PP? What additional data are available in Table 1a? • Examine scores presented in Table 1c in relation to College Readiness Standards score ranges? What do these data tell you?
School Data: Profile Summary Report • 3. a. How are the data in Table 2 in the PSR presented differently from the data presented in Charts 4 and 5 in the Presentation Packet? • 3. b. Are they any groups with 5 or fewer students? If so, are the mean scores presented for these groups? • 3. c. Why or why not?
School Data: Profile Summary Report • How are the data in Tables 3 and 4 in the Profile Packet presented differently from the data in Charts 6 and 7 in the Presentation Packet? • a. Do Tables 5a and 5b in the Profile Packet relate to Chart 6 in the Presentation Packet? • b. What additional data are available in Tables 5a and 5b? • What are “local supplemental items” in Table 6 in the Profile Packet?
Correlating EPAS Data:LEAP and GEE • EXPLORE to LEAP 21 • PLAN to GEE 21
Complete the tables on your worksheet Based on the 2005 scores, how many students can be predicted to achieve:
Analyze and Interpreting Test Score Data • Examine Table 1a on page 2 of the Profile Summary Report – Catherine Letendre • Use your graph paper to graph EXPLORE and PLAN mean scores • Discuss implications for instruction