Download
1 / 43
430 likes | 438 Vues
Ecology Biomes and Ecosystems. Ecosystems- Matter and Energy. Primary Production. http://www.bigelow.org/foodweb/chemosynthesis.jpg. Visualizing Matter & Energy.

E N D
Ecology Biomes and Ecosystems
Primary Production http://www.bigelow.org/foodweb/chemosynthesis.jpg
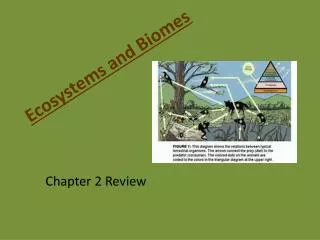
Visualizing Matter & Energy There are a variety of diagrams that help us visualize how energy, biomass, matter, and even number of organisms interact in a particular community or ecosystem. It is important that you look carefully at the diagrams and understand what it says about that ecosystem in terms of matter and/or energy.
Primary Production made by Primary Producers Gross primary productivity is the total amount of energy that producers convert to chemical energy in organic molecules per unit of time. Then the plant must use some energy to supports its own processes with cellular respiration such as growth, opening and closing it’s stomata, etc. What is left over in that same amount of time is net primary productivity which is the energy available to be used by another organism.
Biomass Pyramids • I think this slide should go up with the other pyramid slides even though it’s about populations
http://www.theenergylibrary.com/files/images/Energy_Allocation.screen.jpghttp://www.theenergylibrary.com/files/images/Energy_Allocation.screen.jpg
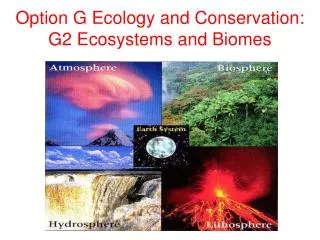
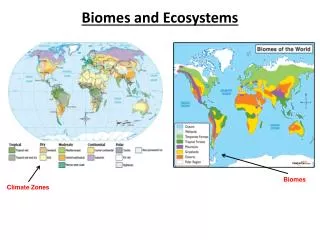
Now that we have examined the flow of energy and the cycling of matter, let’s examine biomes from the biosphere.
Zonation Marine Zonation Lake Zonation
Wetlands & Estuaries Transitional Zones between freshwater and marine. This water tends to be a mix of both depending on its geographic location. The water is often referred to as brackish
Marine Biomes Tide Zone Coral Reef Benthos Black Smoker
Taiga Also called Coniferous or Boreal Forest 1. precipitation usually snow 2. conifers like spruce, fir, hemlock 3. soil acidic and forms slowly
What happens when a cycle is out of balance? Cycles can have an anthropogenic (man-made) or a non-anthropogenic (natural phenomena) impact that causes a cycle to become unbalanced. Additionally, this may just be the natural state of that ecosystem as a consequence of the availability of nutrients. Two examples involving imbalanced freshwater habitats include: Oligotrophic waters- low primary productivity Eutrophic waters- high primary productivity
Eutrophic Oligotrophic Lake
Experimental Data The following data was collected from 14 different rivers in Virginia. Use the Station 1 data to calculate the Primary Productivity of a water sample. Report your answer in units of mg Carbon fixed/Liter The needed conversion factors are found on the student formula sheet
Answers to Previous Slides Station 1 4.2 mg O2/L 0.698 = 2.9 mL O2/L 2.9 mL O2/L 0.526= 1.6 mg Carbon fixed/L
Created by: Susan Ramsey VASS Notable contributions by S. Meister