Download
1 / 24
250 likes | 262 Vues
Lecture-4 Sampling Methods 2. Stratified Random Sampling. Engr. Dr . Attaullah Shah. Simple Random Sampling. Used when there is inadequate information for developing a conceptual model for a site or for stratifying a site Any sample in which the probabilities of selection are known

E N D
Lecture-4 Sampling Methods 2. Stratified Random Sampling. Engr. Dr. Attaullah Shah
Simple Random Sampling • Used when there is inadequate information for developing a conceptual model for a site or for stratifying a site • Any sample in which the probabilities of selection are known • Sampling units are chosen by using some method using chance to determine selection
Simple random sampling is the basis for all probability sampling techniques and is the point of reference from which modifications to increase sampling efficiency may be made • Alone, simple random sampling may not give the desired precision
Simple Random Sampling • Advantages • Prior information about population is not necessary • Easy to perform, easy to analyze • Disadvantages • May not give desired precision • Need a sampling frame. • One way to overcome this problem while still keeping the advantages of random sampling is to use stratified random sampling. • This involves dividing the units in the population into non over lapping strata, and selecting an independent simple random sample from each of these strata.
One way to overcome this problem while still keeping the advantages of random sampling is to use stratified random sampling. This involves dividing the units in the population into non over lapping strata, and selecting an independent simple random sample from each of these strata.
Estimation of population mean • Assume that a simple random sample of size n is selected without replacement from a population of N units, and that the variable of interest has values y1, y2, …, yn, for the sampled units. Then the sample mean is: • Sample variance • Sample coefficient of variation: • These values that are calculated from samples are often referred to as sample statistics. The corresponding population values are the population mean μ, the population variance σ2, the population standard deviation σ, and the population coefficient of variation σ/μ.
The sample mean is an estimator of the population mean μ. The difference y − μ is then the sampling error in the mean. This error will vary from sample to sample if the sampling process is repeated, and it can be shown theoretically that if this is done a large number of times, then the error will average out to zero. For this reason, the sample mean is said to be an unbiased estimator of the population mean. • It can also be shown theoretically that the distribution of that is obtained by repeating the process of simple random sampling without replacement has the variance. • The factor [1 − (n/N)] is called the finite-population correction because it makes an allowance for the size of the sample relative to the size of the population. The square root of Var(y) is commonly called the standard error of the sample mean. It will be denoted here by • Since population variance is not usually known, therefore the estimate of the variance of sample mean is given as:
The square root of this quantity is the estimated standard error of the mean: • The accuracy of a sample mean for estimating the population mean is often represented by a 100(1 − α)% confidence interval for the population mean of the form • Commonly used confidence intervals are: • For smaller samples n less than 25, we use t-statistics and the CI is given as: • It is assumed that the variable being measured is approximately normally distributed in the population being sampled. It may not be satisfactory for samples from very non symmetric distributions.
Stratified Random Sampling • Prior knowledge of the sampling area and information obtained from background data may be used to reduce the number of observations necessary to attain specified precision • Goal is to increase precision and control sources of variability in the data
Stratified Random Sampling • Variability between strata must be larger than variability with strata for any benefit to be seen • Sampling within each stratum is done with a Simple Random Sample
Stratified Random Sampling • Advantages • Gives estimates for subgroups • Can be more precise than Simple Random Sampling • Can be more convenient to implement • Disadvantages • Requires prior information about the population • More complicated computation
Potential gains of Stratified Sampling • First, if the individuals within strata are more similar than individuals in general, then the estimate of the overall population mean will have a smaller standard error than can be obtained with the same simple random sample size. • Second, there may be value in having separate estimates of population parameters for the different strata. • Third, stratification makes it possible to sample different parts of a population in different ways, which may make some cost savings possible.
Assume that K strata have been chosen, ith the ith of these having size Ni and the total population size being ΣNi = N. • Then if a random sample with size ni is taken from the ith stratum, the sample mean yi will be an unbiased estimate of the true stratum mean μi, with estimated variance as: • Where siis the sample standard deviation within the stratum. • In terms of the true strata means, the overall population mean is the weighted average.
And the corresponding sample estimate is • with estimated variance • The estimated standard error of is , the square root of the estimated variance, and an approximate 100(1 − α)% confidence interval for the population mean is given by: If the population total is of interest, then this can be estimated by • The estimated standard error of population total: • Again, an approximate 100(1 − α)% confidence interval takes the form
When a stratified sample of points in a spatial region is carried out, it will often be the case that there are an unlimited number of sample points that can be taken from any of the strata, so that Ni and N are infinite. Equation can then be modified to and the equation becomes • Where wi, the proportion of the total study area within the ith stratum, replaces Ni/N.
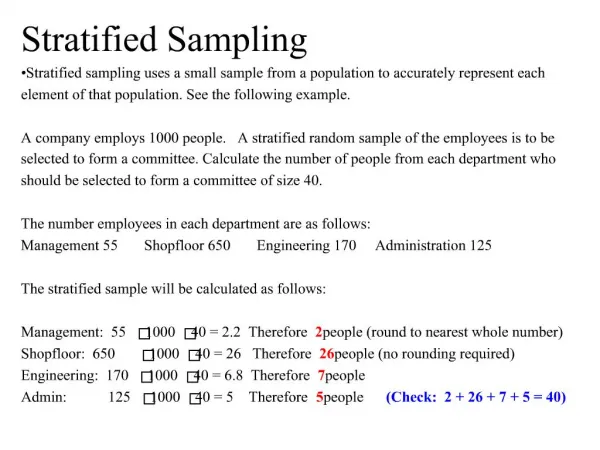
Example 2.3: Bracken Density in Otago • As part of a study of the distribution of scrub weeds in New Zealand, data were obtained on the density of bracken on 1-hectare (ha, 100 ×100 m) pixels along a transect 90-km long and 3-km wide, running from Balclutha to Katiki Point on the South Island of New Zealand, as shown in Figure 2.2 (Gonzalez and Benwell 1994). • This example involves a comparison between estimating the density (the percentage of the land in the transect covered with bracken) using (a) a simple random sample of 400 pixels, and (b) a stratified random sample with five strata and the same total sample size. • There are altogether 27,000 pixels in the entire transect, most of which contain no bracken. The simple random sample of 400 pixels was found to contain 377 with no bracken, 14 with 5% bracken, 6 with 15% bracken, and 3 with 30% bracken. The sample mean is therefore y = 0.625%, the sample standard deviation is s = 3.261, and the estimated standard error of the mean is • The approximate 95% confidence limits for the true population mean density is therefore 0.625 ± 1.96 × 0.162, or 0.31% to 0.94%.
The estimated population mean density from equation given equation is 0.613%, with an estimated variance of 0.0208 from equation The estimated standard error is therefore √0.0208 = 0.144, and an approximate 95% confidence limits for the true population mean density is 0.613 ± 1.96 × 0.144, or 0.33% to 0.90%. • The strata for stratified sampling were five stretches of the transect, each about 18-km long, and each containing 5400 pixels. The sample results and some of the calculations for this sample are shown in Table 2.4.
Post Stratification • Can be used when stratification is appropriate for some key variable, but cannot be done until after the sample is selected • Often appropriate when a simple random sample is not properly balanced according to major groupings
A simple random sample is expected to place sample units in different strata according to the size of those strata. Therefore, post-stratification should be quite similar to stratified sampling with proportional allocation, providing that the total sample size is reasonably large. • It therefore has some considerable potential merit as a method that permits the method of stratification to be changed after a sample has been selected. This may be particularly valuable in situations where the data may be used for a variety of purposes, some of which are not known at the time of sampling.
Statistical Sampling Systemic random samplingrefers to a sampling technique that involves selecting the kth item in the population after randomly selecting a starting point between 1 and k. The value of k is determined as the ratio of the population size over the desired sample size.
Sampling Design II: Systematic Sampling Design: A Grid Scheme is most common FOR 220 Aerial Photo Interpretation and Forest Measurements
Sampling Design II: Systematic Sampling Arguments: For: Regular spacing of sample units may yield efficient estimates of populations under certain conditions. *** Against: Accuracy of population estimates can be low if there is periodic or cyclic variation inherent in the population. FOR 220 Aerial Photo Interpretation and Forest Measurements
Sampling Design II: Systematic Sampling Arguments: For: There is no practical alternative to assuming that populations are distributed in a random order across the landscape. Against: Simple random sampling statistical techniques can’t logically be applied to a systematic design unless populations are assumed to be randomlydistributed across the landscape. FOR 220 Aerial Photo Interpretation and Forest Measurements
Sampling Design II: Systematic Sampling Summary: We can (and often do) use systematic sampling to obtain estimates about the mean of populations. When an objective, numerical statement of precision is required, however, it should be viewed as an approximation of the precision of the sampling effort. (i.e. 95% confidence intervals) Use formulas presented for simple random sampling, and where appropriate, use the “without replacement” variations of those equations (if sampling from a small population), otherwise use the normal SRS statistical techniques. FOR 220 Aerial Photo Interpretation and Forest Measurements