Download
1 / 64
640 likes | 646 Vues
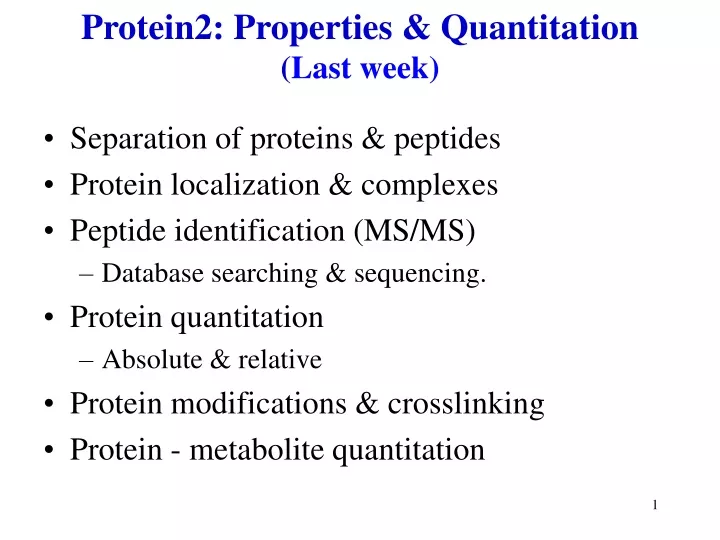
This article discusses the properties and quantitation of proteins, including their separation, localization, identification, and modifications. It covers techniques such as protein quantitation, peptide identification through MS/MS, and database searching and sequencing. The text language is English.

E N D
Protein2: Properties & Quantitation (Last week) • Separation of proteins & peptides • Protein localization & complexes • Peptide identification (MS/MS) • Database searching & sequencing. • Protein quantitation • Absolute & relative • Protein modifications & crosslinking • Protein - metabolite quantitation
Net1: Simulation & optimization • Macroscopic continuous concentration rates • Cooperativity & Hill coefficients • Bistability • Mesoscopic discrete molecular numbers • Approximate & exact stochastic • Chromosome Copy Number Control • Flux balance optimization • Universal stoichiometric matrix • Genomic sequence comparisons
Networks Why model? Red blood cell metabolism Enzyme kinetics (Pro2) Cell division cycle Checkpoints (RNA2) Plasmid Copy No. Control Single molecules Phage l switch Stochastic bistability Comparative metabolism Genomic connections Circadian rhythm Long time delays E. coli chemotaxis Adaptive, spatial effects also, all have large genetic & kinetic datasets.
Types of interaction models Quantum Electrodynamics subatomic Quantum mechanics electron clouds Molecular mechanics spherical atoms (101Pro1) Master equations stochastic single molecules (Net1) Phenomenological rates ODE Concentration & time (C,t) Flux Balance dCik/dt optima steady state (Net1) Thermodynamic models dCik/dt = 0 k reversible reactions Steady State SdCik/dt = 0 (sum k reactions) Metabolic Control Analysis d(dCik/dt)/dCj (i = chem.species) Spatially inhomogenous models dCi/dx Increasing scope, decreasing resolution
In vivo &(classical) in vitro 1) "Most measurements in enzyme kinetics are based on initial rate measurements, where only the substrate is present… enzymes in cells operate in the presence of their products" Fell p.54 (Pub) 2) Enzymes & substrates are closer to equimolar than in classical in vitro experiments. 3) Proteins close to crystalline densities so some reactions occur faster while some normally spontaneous reactions become undetectably slow. e.g. Bouffard, et al., Dependence of lactose metabolism upon mutarotase encoded in the gal operon in E.coli. J Mol Biol. 1994; 244:269-78. (Pub)
Human Red Blood CellODE model ADP ATP 1,3 DPG NADH 3PG NAD GA3P 2PG 2,3 DPG FDP DHAP ADP PEP ATP ADP F6P ATP PYR R5P GA3P F6P NADH G6P GL6P GO6P RU5P NAD LACi LACe X5P S7P E4P ADP NADP NADP NADPH NADPH ATP GLCe GLCi Cl- 2 GSH GSSG GA3P F6P ADP K+ NADPH NADP pH ATP Na+ ADP HCO3- ADO AMP ADE ADP ATP PRPP INO IMP ATP ADOe AMP PRPP ODE model Jamshidi et al. 2000 (Pub) ATP INOe R5P R1P ADEe HYPX
Factors Constraining Metabolic Function • Physicochemical factors • Mass, energy, and redox balance: • Systemic stoichiometry • osmotic pressure, electroneutrality, solvent capacity, molecular diffusion, thermodynamics • Non-adjustable constraints • System specific factors • Capacity: • Maximum fluxes • Rates: • Enzyme kinetics • Gene Regulation • Adjustable constraints
Dynamic mass balances on each metabolite Vtrans Vdeg Vsyn Vuse Time derivatives of metabolite concentrations are linear combination of the reaction rates. The reaction rates are non-linear functions of the metabolite concentrations (typically from in vitro kinetics). • vj is the jth reaction rate, b is the transport rate vector, Sij is the “Stoichiometric matrix” = moles of metabolite i produced in reaction j
RBC model integration Reference Glyc- PPP ANM Na+/K+ Osmot. Trans- Hb-5 Gpx Shape olysis Pump port ligands Hb Ca Rapoport ’74-6+ - - - - - - - - - Heinrich ’77 + - - - - - - - - - Ataullakhanov’81 ++ - - - - - - - - Schauer ’81 + - + - - - - - - - Brumen ’84 + - - ++ - - - - - Werner ’85 + - - +++ - - - - Joshi ’90 + + + + + + - - - - Yoshida ’90 - - - - - - + - - - Lee ’92 + + + + + + (+) - - - Gimsa ’98 - - - - - - - - - + Destro-Bisol ‘99 - - - - - - - (-) - - Jamshidi ’00+ + + + + + - - - -
Scopes & Assumptions • Mechanism of ATP utilization other than nucleotide metabolism and the Na+/K+ pump (75%) is not specifically defined • Ca2+ transport not included • Guanine nucleotide metabolism neglected • little information, minor importance • Cl-, HCO3-, LAC, etc. are in “pseudo” equilibrium • No intracellular concentration gradients • Rate constants represent a “typical cell” • Surface area of the membrane is constant • Environment is treated as a sink
AMP Enzyme Kinetic Expressions Phosphofructokinase v F6P
Kinetic Expressions • All rate expressions are similar to the previously shown rate expression for phosphofructokinase. • Model has 44 rate expressions with ~ 5 constants each ~ 200 parameters • What are the assumptions associated with using these expressions?
Kinetic parameter assumptions • in vitro values represent the in vivo parameters • protein concentration in vitro much lower than in vivo • enzyme interactions (enzymes, cytoskeleton, membrane, …) • samples used to measure kinetics may contain unknown conc. of effectors (i.e. fructose 2,6-bisphosphate) • enzyme catalyzed enzyme modifications • all possible concentrations of interacting molecules been considered (interpolating) • e.g. glutamine synthase (unusually large # of known effectors) • 3 substrates, 3 products, 9 significant effectors • 415 (~109) measurements: 4 different conc. of 15 molecules (Savageau, 1976) • in vivo probably even more complex, but approximations are effective. • have all interacting molecules been discovered? • and so on …
Additional constraints:Physicochemical constrains Osmotic Pressure Equilibrium (interior & exterior, m chem. species) Electroneutrality (z = charge, Concentration)
RBC steady-state in vivo vs calculated |obs-calc| = Y sd(obs) X= metabolites (ordered by Y)
A K DA = K = K DB B A Circular motion Return to steady state B Phase plane diagrams: concentration of metabolite A vs B over a specific time course 1 2 3 4 1: conservation relationship. 2: a pair of concentrations in equilibrium 3: two dynamically independent metabolites 4: a closed loop trace
ATP load Red 0 hours Green 0.1 Blue 1.0 Yellow 10 End 300
RedoxLoad 0 to 300 hour dynamics 34 metabolites calculated ODE model Jamshidi et al. 2000 (Pub)
2,3 DPG RBC Metabolic “Machinery” Glucose Transmembrane Pumps ATP Nucleotide Metabolism Maintenance & Repair Glycolysis PPP Oxidants Hb Met Hb NADH HbO2 2,3 DPG O2 Pyruvate Lactate
. Cell DivisionCycleG2 arrestto M arrest switch
. Hill coefficients Response R= 1 1+(K/S)H H simple hyperbolic = 1 H (R=HbO2, S=O2) sigmoidal = 2.8 H (R=Mapk-P, S=Mos) = 3 H (R=Mapk-P, S=Progesterone in vivo) = 42
“The biochemical basis of an all-or-none cell fate switch in Xenopus oocytes.” Progesterone AA Mos Mos-P Mek Mek-P Mapk Mapk-P k1 k2 k-1 k-2 positive (a chain of enzyme modifiers close to saturation generate higher sensitivity to signals than one enzyme can) Science 1998;280:895-8 Ferrell & Machleder, (Pub)
Net1: Simulation & optimization • Macroscopic continuous concentration rates • Cooperativity & Hill coefficients • Bistability • Mesoscopic discrete molecular numbers • Approximate & exact stochastic • Chromosome Copy Number Control • Flux balance optimization • Universal stoichiometric matrix • Genomic sequence comparisons
Arkin A, Ross J, McAdams HH Genetics 1998 149(4):1633. Stochastic kinetic analysis of developmental pathway bifurcation in phage lambda-infected E. coli cells. Variation in level, time & whole cell effect
Efficient exact stochastic simulation of chemical systems with many species & many channels "the Next Reaction Method, an exact algorithm ...time proportional to the logarithm of the number of reactions, not to the number of reactions itself". Gibson & Bruck, 1999; J. Physical Chemistry. (Pub) Gillespie J.Phys Chem 81:2340-61. 1977. Exact stochastic simulation of coupled chemical reactions
Utilizing Noise Hasty, et al. PNAS 2000; 97:2075-2080, Noise-based switches and amplifiers for gene expression (Pub) “Bistability ... arises naturally... Additive external noise [allows] construction of a protein switch... using short noise pulses. In the multiplicative case, ... small deviations in the transcription rate can lead to large fluctuations in the production of protein”. Paulsson, et al. PNAS 2000; 97:7148-53. Stochastic focusing: fluctuation-enhanced sensitivity of intracellular regulation. (Pub)(exact master equations)
Net1: Simulation & optimization • Macroscopic continuous concentration rates • Cooperativity & Hill coefficients • Bistability • Mesoscopic discrete molecular numbers • Approximate & exact stochastic • Chromosome Copy Number Control • Flux balance optimization • Universal stoichiometric matrix • Genomic sequence comparisons
Copy Number Control Models • Replication of ColE1 & R1 Plasmids • Determine the factors that govern the plasmid copy number • cellular growth rate • One way to address this question is via the use of a kinetic analysis of the replication process, and relate copy number to overall cellular growth. • Why? the copy number can be an important determinant of cloned protein production in recombinant microorganisms
ColE1 CNC mechanism DNAPolymerase RNA II Rnase H cleaved RNAII forms a primer for DNA replication RNase H Rom protein RNA I RNAPolymerase RNA II RNA I "antisense" binds RNA II, blocks RNaseH
DNAPolymerase RNA II RNase H Rom protein RNA I RNAPolymerase RNA II • Where do we start? • Dynamic mass balance • What are the important parameters? • Plasmid, RNA I, RNA II, Rom, m • All the constants • degradation, initiation, inhibition • RNaseH rate is very fast instantaneous • DNA polymerization is very rapid • Simplify by subsuming [RNA II] model RNA I inhibition • RNA I and RNA II transcription is independent (neglect convergent transcription) • Rom protein effects constant • Consider 2 species: RNA I and plasmid • Many more assumptions... Assumptions?
Dynamic Mass Balance: ColE1 RNAI[concentration in moles/liter] Rate of change of [RNA I] Synthesis of RNA I Degradation of RNA I Dilution due to cell growth = - - R = [RNA I] k1 = rate of RNA I initiation N = [plasmid] kd = rate of degradation m= growth rate Keasling,& Palsson (1989) J theor Biol136, 487-492; 141, 447-61.
Dynamic Mass Balance: ColE1 Plasmid Rate of change of [N] Plasmid Replication Dilution due to cell growth = - R = [RNA I] k2 = rate of RNA II initiation N = [plasmid] KI = RNA I/RNA II binding constant (an inhibition constant) m= growth rate Solve for N(t).
Mathematica ODE program Formulae for steady state start at mu=1 shift to mu=.5 and then solve for plasmid concentration N as a function of time.
Stochastic models for CNC Paulsson & Ehrenberg, J Mol Biol 1998;279:73-88. Trade-off between segregational stability and metabolic burden: a mathematical model of plasmid ColE1 replication control. (Pub), J Mol Biol 2000;297:179-92. Molecular clocks reduce plasmid loss rates: the R1 case. (Pub) While copy number control for ColE1 efficiently corrects for fluctuations that have already occurred, R1 copy number control prevents their emergence in cells that by chance start their cycle with only one plasmid copy. Regular, clock-like, behaviour of single plasmid copies becomes hidden in experiments probing collective properties of a population of plasmid copies ... The model is formulated using master equations, taking a stochastic approach to regulation”
From RBC & CNC to models for whole cell replication? • e.g. E. coli ? • What are the difficulties? • The number of parameters • Measuring the parameters • Are parameters measured in vitro representative to the parameters in vivo
Factors Constraining Metabolic Function • Physicochemical factors: • Mass, energy, and redox balance: • Systemic stoichiometry • osmotic pressure, electroneutrality, solvent capacity, molecular diffusion, thermodynamics • Non-adjustable constraints • System specific factors: • Capacity: • Maximum fluxes • Rates: • Enzyme kinetics • Gene Regulation • Adjustable constraints
Net1: Simulation & optimization • Macroscopic continuous concentration rates • Cooperativity & Hill coefficients • Bistability • Mesoscopic discrete molecular numbers • Approximate & exact stochastic • Chromosome Copy Number Control • Flux balance optimization • Universal stoichiometric matrix • Genomic sequence comparisons
Dynamic mass balances on each metabolite Vtrans Vdeg Vsyn Vuse Time derivatives of metabolite concentrations are linear combination of the reaction rates. The reaction rates are non-linear functions of the metabolite concentrations (typically from in vitro kinetics). Where vj is the jth reaction rate, b is the transport rate vector, Sij is the “Stoichiometric matrix” = moles of metabolite i produced in reaction j
Flux-Balance Analysis • Make simplifications based on the properties of the system. • Time constants for metabolic reactions are very fast (sec - min) compared to cell growth and culture fermentations (hrs) • There is not a net accumulation of metabolites in the cell over time. • One may thus consider the steady-state approximation.
Flux-Balance Analysis • Removes the metabolite concentrations as a variable in the equation. • Time is also not present in the equation. • We are left with a simple matrix equation that contains: • Stoichiometry: known • Uptake rates, secretion rates, and requirements: known • Metabolic fluxes: Can be solved for! In the ODE cases before we already had fluxes (rate equations, but lacked C(t).
Additional Constraints • Fluxes >= 0 (reversible = forward - reverse) • The flux level through certain reactions is known • Specific measurement – typically for uptake rxns • maximal values • uptake limitations due to diffusion constraints • maximal internal flux
Flux Balance Example Flux Balances: A: RA – x1 – x2 = 0 B: x1 – RB = 0 C: 2 x2 – RC = 0 Supply/load constraints: RA = 3 RB = 1 RB x1 B RA A RC x2 2C Equations: A: x1+x2 = 3 B: x1 = 1 C: 2 x2 – RC = 0
FBA Example 1 B 1 3 A 4 2 2C
FBA • Often, enough measurements of the metabolic fluxes cannot be made so that the remaining metabolic fluxes can be calculated. • Now we have an underdetermined system • more fluxes to determine than mass balance constraints on the system • what can we do?
Incomplete Set of Metabolic Constraints • Identify a specific point within the feasible set under any given condition • Linear programming - Determine the optimal utilization of the metabolic network, subject to the physicochemical constraints, to maximize the growth of the cell Assumption: The cell has found the optimal solution by adjusting the system specific constraints (enzyme kinetics and gene regulation) through evolution and natural selection. Find the optimal solution by linear programming FluxC FluxB FluxA
Under-Determined System • All real metabolic systems fall into this category, so far. • Systems are moved into the other categories by measurement of fluxes and additional assumptions. • Infinite feasible flux distributions, however, they fall into a solution space defined by the convex polyhedral cone. • The actual flux distribution is determined by the cell's regulatory mechanisms. • It absence of kinetic information, we can estimate the metabolic flux distribution by postulating objective functions(Z) that underlie the cell’s behavior. • Within this framework, one can address questions related to the capabilities of metabolic networks to perform functions while constrained by stoichiometry, limited thermodynamic information (reversibility), and physicochemical constraints (ie. uptake rates)
FBA - Linear Program • For growth, define a growth flux where a linear combination of monomer (M) fluxes reflects the known ratios (d) of the monomers in the final cell polymers. • A linear programming finds a solution to the equations below, while minimizing an objective function (Z). Typically Z= ngrowth (or production of a key compound). • i reactions
Very simple LP solution RC Flux Balance Constraints: RA = RB RA< 1 x1 + x2< 1 x1 >0 x2 > 0 C x1 RB RA A B x2 D RD Max Z = Max RD Production x2 Feasible flux distributions Max Z = RC Production x1
Applicability of LP & FBA • Stoichiometry is well-known • Limited thermodynamic information is required • reversibility vs. irreversibility • Experimental knowledge can be incorporated in to the problem formulation • Linear optimization allows the identification of the reaction pathways used to fulfil the goals of the cell if it is operating in an optimal manner. • The relative value of the metabolites can be determined • Flux distribution for the production of a commercial metabolite can be identified. Genetic Engineering candidates