Download
1 / 21
210 likes | 304 Vues
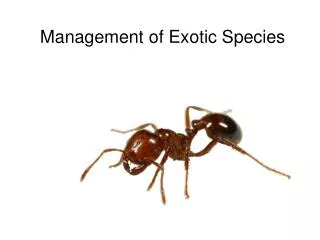
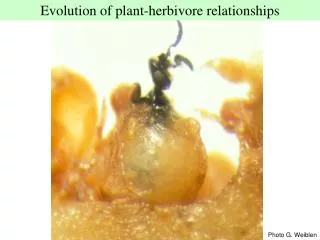
Exotic Herbivore Species Grazing Effect On Plant Life. Module 5. SEE-U 2001 Biosphere 2 Center, AZ. Yuko Chitani Mei Ying Lai Lily Liew Asma Madad. Adam Nix Eli Pristoop J.C. Sylvan. Prof. Tim Kittel, TA Erika Geiger. Introduction.

E N D
Exotic Herbivore Species Grazing Effect On Plant Life Module 5 SEE-U 2001 Biosphere 2 Center, AZ Yuko Chitani Mei Ying Lai Lily Liew Asma Madad Adam Nix Eli Pristoop J.C. Sylvan Prof. Tim Kittel, TA Erika Geiger
Introduction A community is all associated species within a given area. A variety of factors act to structure communities — factors as varied as weather fluctuations and natural disasters, to exotic species introductions, to the natural tension between producers and consumers. Whether or not the plant is killed, however, herbivory has the potential to dramatically alter plant and animal communities. In this study the question at hand was, how grazing effects a community? What is the effect of herbivory on plant community diversity and species abundance? It is important to find out the influences that cattle grazing has on sonoran desert land. Understanding the functioning of communities is essential to conserve endangered ecosystems and the species therein. The only way to accumulate data on this is to measure the percent of plant life forms.
Methods Three different sites were chosen to represent the varying intensity of herbivory on plant communities: area 1 experienced little or no grazing by cattle. Area 2, which was fenced off, experienced moderate grazing by cattle; 64 head of cattle ranged this area for a period of 3 months prior to this study. Area 3, also fenced off, was highly utilized by neighboring ranchers as rangeland. Observation indicated that this area had experienced a high intensity of cattle grazing. The line intercept sampling was used to determine the aerial cover of species (as oppsed to basal cover) on a 50-meter line within the three sites. The distance of the line to the fence of each respective site was also recorded. The line was then divided into 10-meter sections. Working in pairs, we identified each intersecting species and their coverage.
Sample bags were labeled with: site, location on the 10-meter sections from which it was collected, specie name, and lifeform. 6 GPS readings were taken at the three sites, at the beginning and end of the line. The data was then put into Excel. We selected four other species that were representative of the changes in the percent cover over the three areas: Boraginaceae Family #1, Calliandra eriophylla, Hilaria belangeri, Opuntia engelmanni Absolute percent cover measures the specie’s proportion in respect to the length of the line sampled (50m). Relative percent cover measures the specie’s proportion in respect to the total length of all species sampled (>50m).
Plant Lifeform Classification Sarcostemma cynanchoides sp. Hartwegii, a vine, was classified as a perennial forb.
Results RESULTS • 1) Plant coverage: Area 1 (ungrazed) > Area 2 (moderately grazed) > Area 3 (heavily grazed). The percent coverage of annual forbs dropped from 55% relative coverage in Area 1 to 52% in Area 2 to only 14% in Area 3 (see fig. 1, 2, 3). • 2) As total plant coverage diminished, relative and absolute % values achieved parity (see fig. 3). • 3) Overall bare ground increased from Area 1< 2 < 3 (see fig. 4, 9). • 4) Four species represent the changes in the percent cover over the three areas: Boraginaceae Family #1, Calliandra eriophylla, Hilaria belangeri, Opuntia engelmanni. While some species displayed a decrease in percent cover, others tended to increase (e.g. succulents increases from Area 1 (9.2%) to Area 2 (16.5%) and Area 3 (24.2%)) (see fig. 9). • 5) Species diversity remains constant over three areas (see fig. 10). • 6) Lifeform diversity also remains constant over three areas (see fig. 10).
Hilaria belangeri • Lepidium lasiocarpum • Leptochloa dubia = Species B • Lupinus concinnus(?) • Machaeranthera tagetina • Microseris linearifolia = Species D • Opuntia chlorotica • Opuntia engelmanni • Opuntia phaeacantha • Opuntia spinosior • Plantago patagonica • Prosopis velutina = Mesquite • Sarcostemma cynanchoides ssp. Hartwegii • Sisymbrium irio L. • Tridens muticus = Species J2 • Triodanis perfoliata = Species J1 • Viguiera longifolia = Species F • Species I • BARE GROUND • DUNG • LITTER Plant Species Found at Sites • Acacia greggii • Ambrosia confertiflora • Androsace occidentalis • Aristida ternipes var. gentilis • Boraginaceae Family #1 • Boraginaceae Family #2 = Species K • Boraginaceae Family #3 • Bothriochloa barbinodis • Bouteloua curtipenbula • Bouteloua hirsuta • Bromus rubens • Calliandra eriophylla • Chenopodium sp. • Daucus pusillus = Species H • Descurainia pinnata = Species E • Echinocereus • Elymus elymoides • Eragrostis curvula • Eragrostis intermedia • Erigeron divergens = Species A • Eriogonum wrightii • Gilia sp. • Gnaphalium
Discussion How Does Grazing Affect Plant Community Diversity and Species Abundance? To answer this question, we studied three different sites: Area 1 an ungrazed range, Area 2 a moderately grazed range, and Area 3 a heavily grazed open range. From general observation, it was clear that the heavily grazed site had the least abundance of plants and a lot of bare ground between markings. It also took us considerably less time to sample the heavily grazed site than it did for the other two sites. We measured the plant community’s overall richness of species by analyzing the number of species found and collected in each of the three areas. The possible sources of error include: misidentification of plants, inconsistency and inaccuracy in measuring technique, uncertainty in whether the lines sampled were representative of the different areas.
Conclusion • Intense herbivory has an effect on the lifeform composition of the plant community. • However, herbivory does not necessarily affect the biodiversity of the community. • In this exercise we learned: • Plant identification and classification • Relative and absolute percent coverages
References Epple, Anne Orth. A Field Guide to the Plants of Arizona. Lew Ann Publishing Company, Mesa, Arizona. 1995. Gould, Frank W. Grasses of the Southwestern United States. University of Arizona Press, Tucson. 1993. Kearney, Thomas H. and Peebles, Robert H. Arizona Flora. University of California Press, Berkeley. 1960. Niehaus, Theodore F. A Field Guide to Southwestern and Texas Wildflowers. Houghton Mifflin Co., New York. 1984. Robbins, Travis, David Lancaster, Janna Lancaster and Dr. Tony Burgess. Biosphere 2 Centre Plant Field Guide. (Unpublished). Thanks to Tim and Erika for their expertise in plant identification.