Download
1 / 39
390 likes | 393 Vues
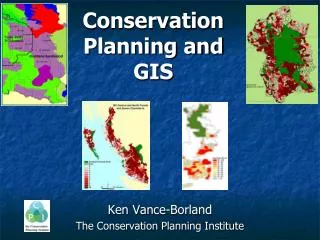
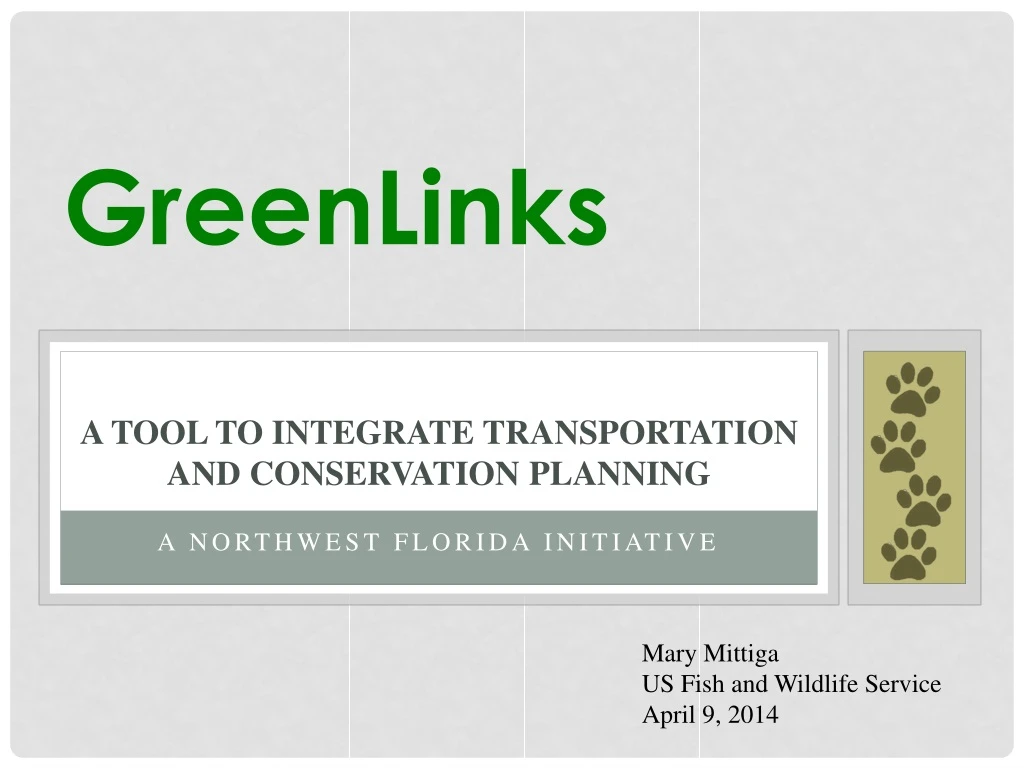
GreenLinks is a landscape-level approach and tool for better planning that aims to strategically protect and manage a network of conservation lands essential for sustaining ecological functions and values in Northwest Florida. It provides a framework for planning land development activities, including transportation projects, and identifies opportunities for locating parks, trails, and green spaces for human use.

E N D
GreenLinks a tool to integrate transportation and conservation planning A northwest Florida initiative Mary Mittiga US Fish and Wildlife Service April 9, 2014
Based on Green Infrastructure • A strategically planned and managed network of natural lands, working landscapes, and other open spaces that conserve ecosystem values and functions, and provide associated benefits to human populations.
strategic planning helps protect many things we value Beaches Historic sites Clean, abundant water Hiking Heritage Sense of place Native plants Traditional values Quiet Hunting Water sports Natural beauty Fishing Military lands Working landscapes Diverse wildlife Bird watching C. Hess
What is greenlinks? • A landscape-level approach • A shared vision among partners • Objective, science-based process • Identifies conservation priorities • A tool for better planning • Consistent with TRB’s SHRP2 C06 -“Integrated Ecological Framework”
What it isn’t… • A land acquisition plan • A regulatory requirement • It’s not “perfect”. On-the-ground resource knowledge and survey data are always important!
partnership • Funded by U.S. Fish and Wildlife Service • Conducted by Dr. Tom Hoctor, University of Florida, with support from Jon Oetting, Florida Natural Areas Inventory • Technical advisory group: Florida Department of Transportation Florida Fish and Wildlife Conservation Commission Florida Forest Service National Marine Fisheries Service U.S. Army Corps of Engineers U.S. Fish and Wildlife Service & others
Goals • Strategically protect and manage a network of conservation lands essential for sustaining the area’s diverse ecological functions and values into the future; • Provide a framework for planning land development activities, including transportation projects; and • Identify opportunities for locating parks, trails, and other green space to benefit human use.
Project history • 2006 – Federal framework for melding infrastructure and ecological planning (Eco-Logical: An Ecosystem Approach to Developing Infrastructure Projects) • 2010 – USFWS hosts local training (Strategic Conservation Planning Using A Green Infrastructure Approach) • 2011 – USFWS contracts with Dr. Hoctor, UF Center for Conservation Planning, to develop regional green infrastructure plan • 2013 – GreenLinks project completed. Further information at: http://www.fws.gov/PanamaCity/greenlinks.html Photo by Carlton Ward
Project extent • Ten counties west of the Apalachicola River Holmes Escambia Okaloosa Jackson Santa Rosa Walton Washington Calhoun Bay Gulf of Mexico Gulf
Greenlinks Products • Conservation Priority Database • 3 sub-databases • 50 data layers • Models • Regional Ecological Network (REN) • CLIP & Regional Ecological Data Synthesis (CRES) • Regional CLIP Model (REN + CRES) • Regional Overlay Model • GreenLinks Priority Model (Regional CLIP P1 Overlay Model)
Regional ecological network (REN) • Rules-based model • Aggregated prioritization • Five data layers Regional Ecological Network Florida Ecological Greenway Network Black Bear Habitat & Connectivity Major River Buffers Xeric Habitat Connectivity Riparian Network
Regional EcologicalNetwork Combination of Florida Ecological Greenways Network (FEGN), Florida Black Bear Habitat and Corridor Analysis, Major River Buffers, Xeric Habitat Connectivity, and the Riparian Network. Priority 1 FEGN Critical Linkages Florida black bear PPCAs and SHCAs bear corridor Major River buffers P1 Riparian Network Priority 2 FEGN P1-P5 Other bear habitat priorities Xeric Connectivity patches 5,000 acres or larger P2 Riparian Network Priority 3 FEGN P6 Xeric Connectivity patches 1,000 - 4,999 acres P3 Riparian Network
CLIP & Regional ecological data synthesis (CRES) • Rules-based model • Aggregated prioritization • Six data layers CLIP & Regional Ecological Synthesis Conservation Buffers Under-represented Natural Communities Land Cover – G1/G2 Communities Rare Species Habitat Strategic Habitat Conservation Areas Wetland Priority
CLIP & Regional Ecological data synthesis (CRES) Combination of GL Conservation Buffers, CLIP Under-represented Natural Communities, GL Cooperative Land Cover (CLC) based G1-G2 Natural Communities, CLIP FNAI Rare Species Habitat, CLIP FWC Strategic Habitat Conservation Areas, and CLIP FNAI Wetland Priorities. Priority 1 CLIP FNAIHAB P1-P2 CLIP SHCA P1 CLIP Natural Communities: G1-G3 CLIP Wetlands P1 Conservation Buffers P1-P2 Priority 2 CLIP FNAIHAB P3 CLIP SHCA P2-P3 CLIP NC: G4 CLIP Wetlands P2-P4 Conservation Buffers P3 Priority 3 CLIP FNAIHAB P4-P6 CLIP SHCA P4-P5 CLIP NC: G5 rare + all other regional natural communities ranked G1-G2 CLIP Wetlands P5-P6 Conservation Buffers P4-P5
regional clip • Combination of REN and CRES • Rules-based, maximum • Aggregate model Regional CLIP Regional Ecological Network CLIP & Regional Ecological Data Synthesis • Florida Ecological Greenways Network • Florida Black Bear Habitat and Corridor Analysis • Major River Buffers/Corridors • Xeric Habitat Connectivity • Riparian Network • GL Conservation Land Buffers • FNAI Under-represented Natural Communities • GL Cooperative Land Cover • FNAI Rare Species Habitat • FWC Strategic Habitat Conservation Areas • FNAI Functional Wetlands
Regional CLIP Final aggregated priorities data layer for the GreenLinks study area. Combines the REN and CRES models. Rules-based maximum approach. Each cell is given the highest priority rank from either of the two layers that occurs at that location. The values are: Value 1 = Priority 1 Value 2 = Priority 2 Value 3 = Priority 3
Regional Overlay Model • To define finer classes within basic priorities • Hybrid prioritization • Rules-based; Additive • 3 sub-models Regional Overlay Model Landscapes Biodiversity Surface Water • FNAI Rare NCs • Other NC Priorities • FNAI Rare Species Habitat • FWC SHCAs • Black Bear Habitat • FEGN • Major River Buffers • Xeric Habitat Connectivity • Conservation Land Buffers • Riparian Network • FNAI Surface Waters • FNAI Functional Wetlands
Regional Overlay This is the layer was created by combining the Biodiversity, Landscape, and Surface Water overlay models using a rules-based maximum approach. The values in the layer range from 1-9, where a 1 is the lowest rank and 9 is the highest
Developing the GreenLinks Priority Model Regional Overlay Regional CLIP
GreenLinks Priority Model (Regional CLIP P1 overlay model) This layer combines the Priority 1 areas from the GL Regional CLIP layer with the Final Overlay Model described below in Section IV. This was done by taking the original 9 priority levels in the Final Overlay Model, clipping them to the Regional CLIP P1 boundary, and then reclassifying them into 3 priority levels using the Natural Breaks reclassification method in ArcGIS. Natural Breaks reclassification resulted in these groupings: Overlay Model values 1-5 = low (L3) Overlay Model values 6-7 = moderate (L2) Overlay Model values 8-9 = high (L1) These Overlay Model priority levels were then combined with the Regional CLIP P1 in a second level of priority with CLIP P1 areas in a raster layer with the following values: Value 1 = Priority 1 = P1L1 Value 2 = Priority 2 = P1L2 Value 3 = Priority 3 = P1L3
uses • Can use any of the models • Regional CLIP provides top three priority levels • GreenLinks Priority Model provides information on the “best of the best” within the highest priority area • Forms the “green infrastructure” or ecological framework • One model for multiple metrics (wetlands, connectivity, habitat, • rare species, etc.)
GreenLinks - uses • Can use the Regional CLIP Model to: • Avoid high priority areas (Priority 1) • If unavoidable, then… • Use GreenLinks Priority Model to “fine-tune” alignment to avoid and minimize impacts to highest priority areas (i.e. P1L1) within Priority 1 • Example: Gulf-to-Bay Highway
GreenLinks - uses • Can use the GreenLinks Priority Model to: • Compare corridor alignments to determine which has the least impacts to natural resources • Example: Gulf Coast Parkway
Greenlinks - uses • GreenLinks Priority Model can identify alignments with less impact to highest priority areas for multiple natural resource functions (wetlands, natural communities, rare species habitat, landscape connectivity, etc.) Highest priority
GreenLinks - uses • Can use the GreenLinks Priority Model to: • Identify regionally significant target areas for mitigation • Acquisition, restoration, enhancement • Potential for advance mitigation • Validate the importance of known wetland & species mitigation sites • Example: NWFWMD Umbrella Plan sites
GreenLinks – potential Next Steps • Add to the Environmental Screening Tool. Let’s use it! • Expand to cover all 16 counties in District 3 • Maintain the database and keep it current • Take to more stakeholders • Landscape Conservation Cooperatives • FWC Cooperative Conservation Blueprint • Counties