Download
1 / 39
390 likes | 400 Vues
This paper discusses the optimization of Ford Motor Company's vehicle distribution system through the implementation of a new network design. The approach includes the use of cross-docking and improved information management to reduce transit time and inventory costs. The results to date have shown significant improvements in speed and efficiency.

E N D
Ford Motor Company’s Finished Vehicle Distribution System April 2001 Ellen Ewing Project Director UPS Logistics Dr. John Vande Vate Exec. Director EMIL ISyE Georgia Tech
Outline • Introduction • 1999 Environment • Solution Approach • Network Design • Car Tracker • Implement New Strategy • Results to Date • Summary
Objectives/Motivation • Novel application of cross-docking: Rail-to-Rail • Cross-docking for Speed • Role of modeling • Role of information • Network Management
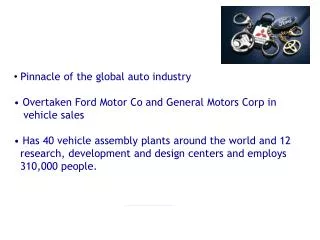
Competitive Necessity • The new BMW Sales and Production System
The Need for Speed Financial Incentives: Capital Utilization • In 1996 • Ford produced 3.9 million vehicles in the US • Avg. transit time 15+ days • Avg. vehicle revenue $18,000 • Value of pipeline inventory: > $2.8 Billion • One day reduced transit time: • $190 Million reduction in pipeline inv. • 1400 fewer railcars
The Need for Speed • Demand for land • 22 Plants • 54 Destination Ramps • ~1,200 Load lanes • ~8,400 vehicles waiting at plants • $166 Million in inventory
The Need for Speed • Other Incentives • Damage • Flexibility
The Price • Inventory at the cross dock • Added distance traveled • Handling at the cross dock • Capital costs of the cross dock
1999 Vehicle Network Delivery Conditions • Record production levels • Demand shift from cars to trucks • Overburdened rail infrastructure • Deteriorating rail service • Shortage of transport capacity • Mixing centers • 15+ day transit time • High inventory cost • Dissatisfied customers
High 1999 Level Statistics • Assembly plants 22 • Mixing centers 5 • Destination rail ramps 54 • Dealer locations 6,000 • Production volume 4.4 Mil./Year • Freight expense $1.5 Bil. • Dec. ‘99 avg. transit time 16.8 Days • Pipeline Inventory $4.1 Bil.
St Paul Canada Michigan Edison Chicago 85% of all Vehicles go via Ohio Rail to a Hub (Mixing Center or Destination Ramp) St Louis Norfolk Kentucky Kansas City 15% of all vehicles go Haulaway Direct to Atlanta Dealer within 200-300 Miles of the Assembly Plant Mixing Center Origin Plant Groupings Destination Ramp Planned Ramp Closure Ford Distribution Network
Old Delivery Design • Push Network • Vendor sub systems optimized for individual segments • Little to no visibility • Mixing Centers not used effectively
Ford Goals • Speed • 1999: Average 15 days transit time • Goal: Maximum of 8 days transit time • Precision • 1998/1999: 37% on time within 1 week • Goal: 95% on time within 1 day • Visibility • 100 % Internet vehicle tracking from plant release to dealer delivery • Guide the flow of vehicles • Respond to variations • Inform customers
Why UPS Logistics Group Chosen? • Global logistics expertise • State-of-the-art technology • Rail experience • Brand identity • Financial stability • Bench strength
Solution Process • Assemble team of experienced operations and network planning personnel from Ford and UPS • Evaluate current system - process mapping • Develop a new “no constraint” vision for the industry • Design a new network • Create a new organization • Implement the new network
Tools Used for Modeling • Supply Chain Strategist from i2 Technologies • Cost Modeling • Cost impact measured for each sort - route combination • Sourcing • Determined optimum sourcing route from ramp to dealer
Ford Locations Plant Mixing Center Origin Ramp Dest. Ramp MC Ramp
Sourcing Solution Process • Input dealer demand volumes by product family and plant location • Create candidate lanes between dealers and closest ramps • Run models to determine optimum ramp to dealer sourcing
Old Ramp AllocationSouthern US Dealers sourced bymultiple ramps
New Ramp AllocationSouthern US Dealers sourced by single ramps
Cost Modeling Solution Process • Assign each plant to a mixing center • Determine rail shipment sizes for all rail lanes • Determine shipments that move direct from plant to dealer • Obtain carrier rates and perform regression analysis of historical shipments
New Rail Lanes Reduced plant destinations
Final Outbound Rail Network with Carriers St Paul Canada Edison Michigan Chicago Ohio St Louis Norfolk Kentucky Kansas City Atlanta Mixing Centers Destination Ramps Union Pacific CSXT FEC BNSF Canadian Pacific Car Haul to Ramp Norfolk Southern Canadian National
Characteristics • Shipment tracking - plant to dealer • Shipment events - customizable based on route specifications • Exception event tracking - alerts & alarms • Financial event tracking • Similar to UPS Package Tracking System
Value Add • Management of supply chain down to individual VINs • Alerts & alarms - “pipeline bottlenecks” • Management of inventory levels • Enhanced communications • Improved accountability of rail provider, mixing center, and convoy carrier resources • Better reporting mechanism
New Organization • Announced new strategic alliance on February 2, 2000 • Launched on March 1 • Manage finished vehicle delivery network • Network design and planning • Carrier selection and rate negotiation • Carrier performance management • Daily network operations • Freight bill payment and claims processing • Staffed by Ford and UPS Autogistics personnel • Offices in Atlanta and Detroit • Operations personnel in key field locations
Results • Cut vehicle transit time by 26% or 4 days • Initiative is 6 months ahead of time • $1 billion savings in vehicle inventory • $125 million savings in inventory carrying costs • Avoid bottlenecks • Reduce assets in supply chain • Less damage • Improved inventory turns at dealer • By end of Q1 2001 network will be fully operational in US, Canada and Mexico
Benefits • Ford • Dealers • Rail Carriers • Auto Haulers
Benefits - Ford • On-time delivery • Supply chain visibility • Competitive edge • Single network manager • Improved accountability • Cost control
Benefits - Dealers • Reduced inventories • Increased customer satisfaction
Benefits - Rail Carriers • Improved equipment utilization (reduced capital expenditures) • Visibility and planning capabilities • Synergies with existing UPS traffic • Increased cooperation
Benefits - Auto Haulers • Expanded dealer delivery hours • Visibility and planning capability • Improved asset utilization • Increased cooperation
Status Report • Now • Car Tracker for Operations • Increased Bypass Loads • Clean Ramps & Mixing Centers • 24 Hour monitoring • 12 Day Network • Future • Transit Merge • Add Customers • Daily Dedicated Rail Networks • Too Many Railcars • Less than 8 Day Network • Before • Sub Optimization • Little Visibility • Mixing Center Concept • Rail Car Shortage • 15 Day Network
The Whole Picture • Mixing Centers • Network design and planning • Carrier selection and rate negotiation • Tracking • Daily network operations • Carrier performance management