Download
1 / 50
500 likes | 509 Vues
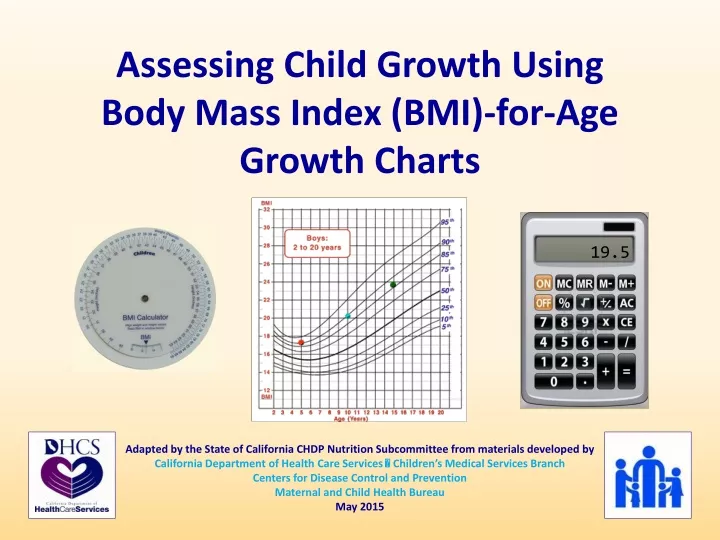
Assessing Child Growth Using Body Mass Index (BMI)-for-Age Growth Charts. 19.5. Adapted by the State of California CHDP Nutrition Subcommittee from materials developed by California Department of Health Care Services Children’s Medical Services Branch

E N D
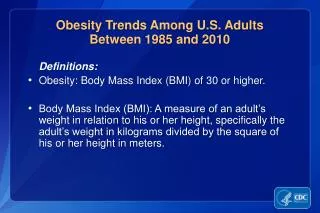
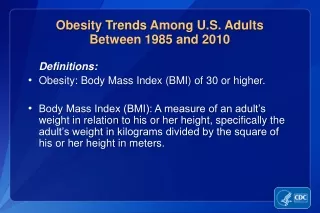
Assessing Child Growth Using Body Mass Index (BMI)-for-Age Growth Charts 19.5 Adapted by the State of California CHDP Nutrition Subcommittee from materials developed by California Department of Health Care Services Children’s Medical Services Branch Centers for Disease Control and Prevention Maternal and Child Health Bureau May 2015
Training Objectives By the end of this presentation, you will be able to: • Select appropriate growth chart for age group • Identify the age range for whichBody Mass Index (BMI) screening is used • Calculate or determine BMI value • Plot BMI value on the appropriate growth chart • Determine BMI-for-age percentile • Identify weight category • Record results on PM 160
Which Growth Chart Should I Use? • Birth to 2? Use WHO • 2 to 20? Use CDC
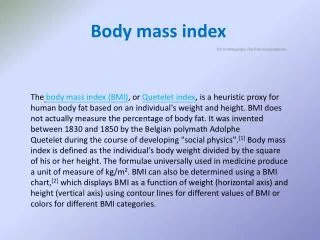
What Is Body Mass Index? • A number calculated using weight and height measurements:Body Mass Index (BMI) =Weight (kg) / Height (m)² • It compares a person’s weight to height • It is an indirectscreening testfor body fatness
Why Use BMI-for-Age? • Lifetime tracking tool • from age 2 through adult • Relates weight, stature and age • Screening for health and nutrition status required by CHDP and health plans • Early indicator of other health risk factors • Hyperlipidemia • Elevated insulin • High blood pressure
Body Mass IndexCutoff Values for Adults • Standard weight categories • Same for all ages 18 + • Same for men and women
For Children, BMI Changes with AgeExample: Child’s growth tracking along 95th percentile
BMI for Children and Teens • Age- and sex-specific • Plot BMI to find percentile • Determine weight status
What is a Percentile? 50th 85th CA CHDP 2010 19% 5th 95th CA CHDP 2010 23% Major Percentile Divisions
CDCGrowth Charts Tip: Download and print from www.cdc.gov/growthcharts/ Formula to calculate BMI Percentile lines5th - 10th - 25th - 50th 75th - 85th - 90th - 95th Published May 30, 2000 (modified 2000-2001)
How to Read and Interpretthe Growth Chart • A single point on the curve indicates current status • A series of BMI plots are needed to determine the growth trend • If growth deviates from the expected growth pattern, further assessment may be needed
Adiposity Rebound A normal increase in BMI after it reaches its lowest point, usually between ages 4 and 6 ↑BMI ↑BMI ↑BMI AGE → AGE → AGE → Child following50th percentile curve Child following10th percentile curve Child following85th percentile curve
Early Adiposity Rebound • An increase in BMIbefore age 5 is calledearly adiposity rebound • An upward BMI trendbefore age 5 is related to higher BMI in adulthood • This is a redflag indicating need for further nutrition and physical activity assessment ↑BMI AGE →
Early Adiposity Rebound ↑BMI ↑BMI AGE → AGE → Without Intervention With Intervention
Excessive Adiposity Rebound • Excessive adiposity rebound is also related tohigher BMI in adulthood • Increasing BMI percentiles that cross major percentile lines are redflags indicating need for further nutrition and physical activity assessment ↑BMI AGE →
Steps to Plot BMI-for-age • Select appropriate growth chart • Measure standing height accurately • Measure weight accurately • Determine BMI value • Determine BMI-for-age percentile • Record BMI percentile on PM 160 • Determine weight category
Chart Carlos CorrectlyStep 1:Select Appropriate Growth Chart • CDC 2 to 20 years: Boys • Stature-for-age • Weight-for-age • BMI-for-age
Step 2:Measure Standing HeightRecord on growth chart and PM 160 453
Step 3:Measure WeightRecord on growth chart and PM 160 453 04308
Step 4A:Determine BMI Value Method 1: Using a calculator • English measurementsWt (pounds) ÷ Ht (inches) ÷ Ht (inches) x 703 • Metric measurementsWt (kg) ÷ Ht (cm) ÷ Ht (cm) x 10,000 TIP: Formulas are listed on the BMI-for-age chart 19.5
Step 4A:Determine BMI Value • Line up the height on inner wheelwith the weight on outer wheel • Read BMI value in the window on the inner wheel Read number and decimal points from right to left! Method 2: Using aBMI calculation wheel
Step 4A:Determine BMI Value Method 3: Using an online calculator or electronic health record • CDC BMI Calculator for Child and Teen • http://apps.nccd.cdc.gov/dnpabmi/Calculator.aspx • Children’s Hospital of Philadelphia Body Mass Index and Z-Score Calculator in Children • http://stokes.chop.edu/web/zscore • Your clinic’s electronic health record system
Step 4A: Determine BMI Value Method 3: Using an online calculator or electronic health record Enter Data View Results
Step 5: Determine BMI-for-Age %ile TIP: Use a transparent growth chart plotting aid • Find age on horizontal axis • Find BMI valueon vertical axis • Mark point of intersection • Estimate BMI percentile
Step 6:Record BMI Percentile on PM 160 • Estimate a whole number between 1 and 99 that best represents the percentile point plotted on the growth chart 45304308 2 5
Step 7A:Determine Weight Category Determined by certifiedCHDP health care provider (MD, NP, or PA)
Step 7B: Record Abnormal Results • On PM 160, enter follow up code in appropriate column under PROBLEM SUSPECTED • Enter diagnosis under COMMENTS/PROBLEMS • Underweight • Overweight • Obese • Carlos’ weight status is normal so there is nothing to record in the comments
Accurate Measurements Are Critical • BMI for 5 year old boy • Weight: 43.5 lb • Height: 43.0 in • BMI= 16.5 • BMI-for-age =75-84th percentile • Normal range • If height is inaccurate: • Weight: 43.5 lb • Height: 42.5 in • BMI = 17.0 • BMI-for-age = 85-94th percentile • Overweight range
Practice Using BMI-for-Age Growth Charts Photo Credit: Eric Peacock. April 2, 2012. Creative Commons Attribution-NonCommercial-ShareAlike 2.0 Generic License https://creativecommons.org/licenses/by-nc-sa/2.0/legalcode
Plot Pete Precisely FIRST STEPS Select appropriate growth chart Measure standing height Measure weight
Plot Pete Precisely 18.0 NEXT STEP Determine BMI Value
Plot Pete Precisely NEXT STEP • DetermineBMI-for-age percentile
Plot Pete Precisely 41004300 9 6 NEXT STEP • Record BMI Percentile on PM 160 • Estimate a whole number between 1 and 99 that best represents the percentile point plotted on the growth chart
Plot Pete Precisely FINAL STEP • Determine category and record on PM 160 if needed • Enter follow up code in appropriate column under PROBLEM SUSPECTED • Enter diagnosis under COMMENTS/PROBLEMS • Underweight • Overweight • Obese (03) Obese
Let’s Look at Liz FIRST STEPS Select appropriate growth chart Measure standing height Measure weight
Let’s Look at Liz 16.9 NEXT STEP Determine BMI Value
Let’s Look at Liz NEXT STEP DetermineBMI-for-age percentile
Let’s Look at Liz NEXT STEP • Record BMI Percentile on PM 160 • Estimate a whole number between 1 and 99 that best represents the percentile point plotted on the growth chart 39103700 8 7
Let’s Look at Liz FINAL STEP • Determine category and record on PM 160 if needed • Enter follow up code in appropriate column under PROBLEM SUSPECTED • Enter diagnosis under COMMENTS/PROBLEMS • Underweight • Overweight • Obese (03) Overweight
Graph Gabriela’s Growth FIRST STEPS Select appropriate growth chart Measure standing height Measure weight
Graph Gabriela’s Growth 13.5 NEXT STEP Determine BMI Value
GraphGabriela’s Growth NEXT STEP • DetermineBMI-for-age percentile
Graph Gabriela’s Growth NEXT STEP • Record BMI Percentile on PM 160 • Estimate a whole number between 1 and 99 that best represents the percentile point plotted on the growth chart 41003208 0 3
Graph Gabriela’s Growth FINAL STEP • Determine category and record on PM 160 if needed • Enter follow up code in appropriate column under PROBLEM SUSPECTED • Enter diagnosis under COMMENTS/PROBLEMS • Underweight • Overweight • Obese (03) Underweight
You have learned to: • Select appropriate growth chart for age group • Identify the age range for whichBody Mass Index (BMI) screening is used • Calculate or determine BMI value • Plot BMI value on the appropriate growth chart • Determine BMI-for-age percentile • Identify weight category • Record results on PM 160
Resources and Clinical Tools • Online tutorials • Online resources • Growth charts • BMI wheels • BMI calculators • Plotting aids
Color-coded BMI Charts 5210 Let’s Go! Eat Smart, Move More North Carolina
References • Prevention of pediatric overweight and obesity. Pediatrics. 112: 424-430, 2003. http://pediatrics.aappublications.org/content/112/2/424.full • Assessment of child and adolescent overweight and obesity.Pediatrics 120: S193-S228, 2007. http://pediatrics.aappublications.org/cgi/content/full/120/Supplement_4/S193 • Expert committee recommendations regarding the prevention, assessment,and treatment of child and adolescent overweight and obesity: summary report. Pediatrics 120 : S164-S192, 2007.http://pediatrics.aappublications.org/cgi/content/abstract/120/Supplement_4/S164 • Recommendations for prevention of childhood obesity.Pediatrics 120 : S229-S253, 2007.http://pediatrics.aappublications.org/cgi/content/abstract/120/Supplement_4/S229 • The validity of BMI as an indicator of body fatness and risk among children. Pediatrics 124: S23-S34, 2009. http://pediatrics.aappublications.org/cgi/content/abstract/124/Supplement_1/S23
Image Credits Slides 3 and 4. Photos with permission. Ventura County CHDP Programand Mandalay Bay Women and Children's Medical Group. 2011. Ventura County Health Care Agency. Slides 17, 18. Photos with permission. Ventura County CHDP Program and Magnolia Family Medical Group. 2004. Ventura County Health Care Agency. Slide 19. US Department of Health and Human Services. Health Resources and Services Administration. Maternal and Child Health Bureau.Accurately Weighing and Measuring Infants, Children and Adolescents: Technique. Slide 28. UC Berkeley Longitudinal Study, 1973. Adapted from theCDC Growth Charts 2000 Slide Set. Division of Nutrition, Physical Activity, and Obesity, National Center for Chronic Disease and Prevention. 2002.