Download

1 / 11
110 likes | 217 Vues
5.2 Variability. Common Core Investigation 5.2. Objective. Today I will compare two box-and-whisker plots and gain information from the data distributions. Vocabulary.

E N D
5.2 Variability Common Core Investigation 5.2
Objective • Today I will compare two box-and-whisker plots and gain information from the data distributions.
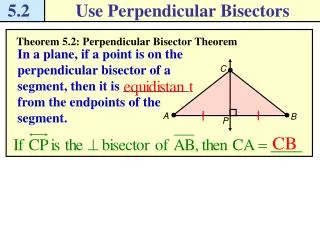
Vocabulary • Measures of variability- numbers that indicate how spread out a set of scores is along a distribution. Scores can be bunched up around the mean or spread out significantly along the distribution. The three measures of variability are range, standard deviation, and variance. • Measures of Center - Plotting data in a frequency distribution shows the general shape of the distribution and gives a general sense of how the numbers are bunched. The mean, median, and mode can be used to represent the "center" of the distribution. • Measures of Shape - For distributions summarizing data from continuous measurement scales, statistics can be used to describe how the distribution rises and drops.
Earnings at each restaurant • Tim is on the wait staff at the Casual Café, and Dan is on the wait staff at Bountiful Bistro. The box plot below display the amounts they earn in tips on weekends during the past six months.
What was the least amount Tim earned? • What was the greatest amount Tim earned? • How do you find the interquartile range for data shown in a box plot?
What is the range of the data displayed in each box plot? • What is the interquartile range of the data displayed in each box plot? • Use the ranges and interquartile ranges of Tim’s and Dan’s tips. Compare how their tips vary.
Are either of the box plots symmetric? • Compare how the amounts of Tim’s and Dan’s tips are distributed. • Which, if any, of the box plots shows clusters of data? • Use evidence of clusters or no clusters to compare Tim’s and Dan’s tips. • Overall, who do you think earns more tip money? Explain.
Bowling Alley • Sarah and DeShawn work part-time at the bowling alley. The box plots show the number of hours they have worked each week this year. • Find the ranges and interquartile ranges of the hours Sarah and DeShawn have worked, and use them to compare how their hours varied.
Bowling Alley • Sarah and DeShawn work part-time at the bowling alley. The box plots show the number of hours they have worked each week this year. • Compare how the amounts of hours Sarah and Deshawn worked are distributed.
Bowling Alley • Sarah and DeShawn work part-time at the bowling alley. The box plots show the number of hours they have worked each week this year. • Does either box plot show clustering or symmetry of data? If so, what does that show about the numbers of hours worked?
Homework • Yellow Packet Pg. 32: 7-11, 15-16