Download
1 / 17
170 likes | 286 Vues
Development of hydrocarbon vapor imaging systems for petroleum and natural gas fugitive emission sensing. Thomas J. Kulp, Karla Armstrong, Ricky Sommers, Uta-Barbara Goers, and Dahv Kliner Sandia National Laboratories Livermore, CA 94551-0969 tjkulp@sandia.gov.

E N D
Development of hydrocarbon vapor imaging systems for petroleum and natural gas fugitive emission sensing Thomas J. Kulp, Karla Armstrong, Ricky Sommers, Uta-Barbara Goers, and Dahv Kliner Sandia National Laboratories Livermore, CA 94551-0969 tjkulp@sandia.gov
Imaging lidar is a powerful tool for gas leak detection • A laser illuminates the scene as it is imaged in the infrared • Gases are visualized when they absorb the backscattered radiation • Conventional leak detection is carried out using handheld sensors • Imaging allows rapid broad area coverage and easy recognition of plume presence and source location Solid surface Laser radiation tuned to gas absorption Gas plume
Gas imaging offers to accelerate leak surveillance, thus decreasing the cost of environmental compliance • Typical refinery spends ~$1M • per year for leak detection and • repair (LDAR) • Currently hand-held “sniffers” • are used according to EPA • Method 21 • The technology in this project is • now being considered as a viable • alternative to Method 21 by a • working group of EPA, API, DOE, • and petroleum industry members • Acceptance will require approval • as an alternative work practice • - laboratory testing • - field evaluations Measured Leak Rate Distribution Data* Smart LDAR concept: Rapid surveys focusing on strong leakers *7 Refineries (all components and services) Source: API Publication 310, November 1997
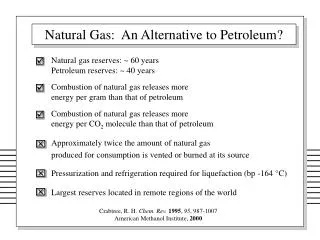
Industry-wide losses of natural gas Production, Processing, Transportation Hardware Transportation Distribution 750 processing plants 3000 compressor stations 103 Bscf (1.98 Tg) / yr. 400,000 miles of pipeline 6 Bscf (0.12 Tg) / yr. 1,400,000 miles of pipeline 42 Bscf (0.8 Tg) / yr. Losses represent a significant product cost and a significant contribution to greenhouse gas flux Cost & Efficiency Surveys mandated annually Surveying costs of $1.6 billion annually Motivation for leak sensing in the US natural gas industry Safety issues 800,000-900,000 leaks addressed each year 200-300 leaks result in accidents
Absorption by the atmosphere Butane absorption Optical depth Frequency (cm-1) Frequency (cm-1) Methane absorption Optical depth 3500 3000 2500 2000 1500 1000 Wavelength (µm) Problem: There has been a lack of BAGI instrumentation that “sees” hydrocarbons critical to the gas and oil industries • Operation near 3.3 µm favored due to • gas and atmospheric absorption • Broad (100-200 cm-1) tuning desirable • to access multiple species • BAGI instruments commercially available • at 9-11 µm but not at 3.3 µm • Basic limitation has been the lack of • suitable laser sources
Detector field-of-view Scanner Laser beam Tunable CW laser Solution: We have developed imagers that use nonlinear conversion to generate tunable mid-IR (3-5 µm) light Snapshot-mode focal-plane array Tunable pulsed laser Beam formatter Scanned imager CW optical parametric oscillator (OPO) Pulsed imager Pulsed DFG-OPA laser
Nonlinear crystal Idler Pump Signal Multi-grating PPLN crystal npump = nsignal + nidler Wide-view Close-up Nonlinear conversion shifts light from one wavelength to another Optical parametric oscillator (OPO) Optical parametric generation • Signal (or idler) wave resonated • Pthr = Watts Pout = 100’s mW - W’s New microengineered nonlinear crystals improve efficiency —> smaller and more tunable systems • Example: Periodically-poled • lithium niobate (PPLN) • Engineered optical axis inversion • 15X more gain than ordinary crystal • Tunable over 1.3 - 4.4 µm
Methane plume at 20 m Computer with frame grabber board and WIT software HSVB Video display 256 x 256 snapshot-mode InSb focal-plane array camera Amber ProView FPA controller Nd:YAG pumped dye laser (repetition rate 30 Hz) Beam formatter The first hydrocarbon imager was a pulsed system Range - 70 m Sensitivity - 36 ppm-m methane 0.02 scf/hr leak rate Kulp, Powers, Kennedy, and Goers Applied Optics 37 3912-3922 (1998)
Differential imaging was demonstrated to improve gas plume visibility for the pulsed imaging system Processing Scale, Ratio, log Methane imaging against grass Methane spectrum Single-wavelength image Differential image Laser Energy (wavenumbers) Powers, Kulp, and Kennedy, Applied Optics 39 1440-1448 (2000)
Breadboard pulsed imager Fieldable pulsed prototype FY98 Development of a CW OPO FY98 Field test van-mounted system FY99 Development of operator- portable system FY00-01 Next step in evolution — Development of CW systems • CW systems offer: • Less expensive imager • (scanner vs array) • Clear commercialization path • Upgrade to diodes • Less susceptible to damage
PPLN fan-out grating used Solid etalon -6 n-hexane 200x10 n-pentane Signal - wavemeter n-butane propane 150 Pump @ 1.064 µm Absorption Intensity 100 Absorption Intensity Idler @ ~ 3.3 µm 50 PPLN Crystal Signal - power monitor 0 2800 2850 2900 2950 3000 3050 3100 Pump dump Wavenumbers [cm-1] -1 Wavenumbers [cm ] A PPLN-based OPO was developed for scanned cw imaging Nd:YAG laser “Generic” refinery wavelength Two periods created: 29.3 - 30.1 µm 29.7 - 30.0 µm Idler tuning range: 2820-3150 cm-1
Turret FOV rotations 3-µm beam Scanner IR image seen by the operator PPLN OPO Nd:YAG laser A van-mounted scanned system employing the PPLN OPO was field tested at a refinery during April, 1999 Gas plume • System tested in parallel • to EPA Method 21 • Imager operated well in • the field environment • Results motivated the • development of a portable • system
April 1999 field demonstration • M21 team independently monitored process areas first • - Measured 1,464 components, primarily valves and pump seals • - All components part of existing LDAR program • Gas Imaging team monitored independently next • - Observed estimated 6,600 components, all types • - All visible parts observed, regardless of whether tagged or not • - Followed-up leak discoveries with vapor analyzer • - Gas Imaging leak discoveries video-taped • Both teams tested seven process areas
Gas imaging found high leakers in three process areas • High leakers above 100,000 ppm were identified by current prototype • Lowest leak independently found was 28,000 ppm • Some leaks at about 30,000+ ppm were missed • Did not find leaks below 10,000 ppm in the refinery setting • Lower detection limit currently appears to be between 25,000 • and 50,000 ppm Restricted access during test motivated the development of an operator-portable imaging system Full results tabulated in a report located on the EPA Website
Goal: Develop an imaging lidar for leak detection that can be battery operated and carried by the system user PPLN OPO Nd:YAG laser Van-mounted and operator-portable raster-scanned imaging lidars • Van-mounted imager successfully tested in natural gas distribution • and petroleum refinery applications. However, access restrictions • prohibits vehicle use in many cases. Natural gas leak in Atlanta Ga
Approach: Develop a system based on a compact CW OPO pumped by a Yb-doped fiber amplifier 3-component scanner “Breadboard” OPO system Van System Water-cooled Nd:YAG laser Miniature Nd:YAG seed laser Fiber Optic Amplifier Compact SR-OPO Consolidated scanner (single unit) • Primary technology competition is diode lasers which cannot produce • sufficient 3.3 µm power at narrow linewidth and require cryogenic cooling • Yb-doped fiber amplifiers demonstrated 45% electrical-optical conversion • CW OPO capable of converting 60-90% of pump output to signal + idler • Fiber amplifier inherently rugged
The Yb-doped fiber amplifier produces high output power in a compact and efficient format Initial system - Polaroid pump diodes • Present diode (JDS) requirement - 4V @ 3.5 A to achieve4W output • No visible SBS with a single-mode seed