Download
1 / 53
530 likes | 613 Vues
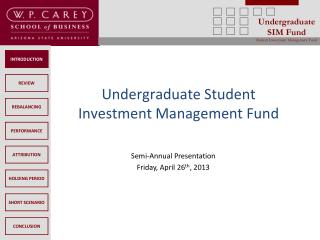
Student Investment Management (SIM) Program. Fiscal 2007 Performance Review. Outline. Objectives, Philosophy, Process – Jeremy Program Enhancements Website – Ramya New York Trip – Autumn RISE Conference – Brad Sample Stock Report – Adam SIM Fiscal YTD Performance – Jeremy.

E N D
Student Investment Management (SIM) Program Fiscal 2007 Performance Review
Outline • Objectives, Philosophy, Process– Jeremy • Program Enhancements • Website – Ramya • New York Trip – Autumn • RISE Conference – Brad • Sample Stock Report – Adam • SIM Fiscal YTD Performance – Jeremy
Objectives 1. To achieve a total return in excess of the Standard and Poor’s (S&P) 500 Index 2. To preserve and maintain the real purchasing power of the fund 3. To enhance the educational experience of the students
Investment Philosophy • The Market is frequently inefficient in the short run • Inefficiencies can be identified through fundamental analysis • Qualitative • Quantitative • Relative Valuation • Mean Reversion • Diversification as a means to manage risk
Investment Process Class Structure - 3 sections: • Modeling and Valuation techniques • Sector Analysis = Top-Down Approach • Current Macro Environment • Dan Roberts, Senior Economist, STRS • Stock Analysis = Bottom Up Approach • Discounted Cash Flow Models • Relative Value Methods (StockVal Software)
Investment Process – Cont. Class Structure (cont.): • New Addition – Chris Henneforth, CFA • Level Partners, Partner • Cantor Fitzgerald, Associate in Debt Capital Markets • Ohio State FCOB MBA, June 2004 • Ohio State FCOB Graduate, June 1998 BSBA
Outline • Objectives, Philosophy, Process– Jeremy • Program Enhancements • Website – Ramya • New York Trip – Autumn • RISE Conference – Brad • Sample Stock Report – Adam • SIM Fiscal YTD Performance – Jeremy
SIM Website • Complete redesign of the SIM website • Ensure consistency with the Fisher brand • Inclusion of dynamic content aimed at encouraging the user to spend more time on the site • Create a powerful marketing tool for the SIM program
SIM Website Future Steps… The maintenance of the SIM website will be handed over to m2 consulting starting next academic year
Outline • Objectives, Philosophy, Process– Jeremy • Program Enhancements • Website – Ramya • New York Trip – Autumn • RISE Conference – Brad • Sample Stock Report – Adam • SIM Fiscal YTD Performance – Jeremy
New York Visit • SIM New York Trip (April 26th-April 27th) • 26 MBA and Undergraduate Students Attended the Trip • Coach - COO Keith Monda Ohio State Grad. • JP Morgan • Lehman Brothers • Alumni Meet and Greet at Brasserie 8 1/2
Outline • Objectives, Philosophy, Process– Jeremy • Program Enhancements • Website – Ramya • New York Trip – Autumn • RISE Conference – Brad • Sample Stock Report – Adam • SIM Fiscal YTD Performance – Jeremy
R.I.S.E. • 3 Day Investment Forum held at University of Dayton • Day 1 Keynote Speakers / Panels • 5 Panel discussions: Economy, Markets, Federal Reserve, Corporate Governance, and Public Policy. • Speakers Included: • Jan Hatzius Chief US Economist, Goldman Sachs • Peter Coors, CEO of Coors Brewing • Patrick Dorsey, Director of Stock Analysis Morninstar • Paul Atkins of the Securities and Exchange Commission • Day 2 Break-Out Sessions • Interactive sessions run by industry professionals ranging from Private Equity to “A day in a life of an equity analyst” • Day 3 Networking and Career Search Strategies
R.I.S.E. • Fisher Participants were subsidized by SIM • 11 Fisher Students Attended (1,600 students total from over 160 Universities) • Key Takeaways • Industry Perspective • Panelist had different views, great to hear them debate. • China – Fear or Opportunity between Economists • Break-Out Session • P/E carried interest is a long term gain (a wow moment for me) • Interactive – Students drove the discussion, able to ask questions that interest you. • Networking Opportunity • I spoke with and got business cards from a dozen people in my chosen field from across the country
Outline • Objectives, Philosophy, Process– Jeremy • Program Enhancements • Website – Ramya • New York Trip – Autumn • RISE Conference – Brad • Sample Stock Report (Valero) – Adam • SIM Fiscal YTD Performance – Jeremy
Adam Grimes Presents Valero Energy
Sector Returns vs. Price of Oil • Conventional wisdom says Energy sector companies make more money when oil prices are high. • But… is this true? And does this equal higher stock prices? • Created an equal-weighted annual log change index of the Energy sector dating back to 1988.
The Oil Price Model: Thesis • “It’s all about oil.” • Goal was to make a limited-scale (large models have thousands of moving parts) supply/demand regression model for oil price. • A complicated task: • relevant data not readily available. • increased supply does not always mean lower price (because at some times and price ranges, supply is the dependent variable). • If possible, would provide an “apples to apples” baseline across the sector.
World Demand • Current (2006) world use is 86.8 million barrels/day. • Projected to grow about 2.1% per year. • Much of the new demand is from China and India. (China is the second largest world consumer of oil, and responsible for 40% of the world demand growth in the past four years.) • Depletion of working fields is 4 mmb/d annually (and accelerating). • Total new additions of 27.5 mmb/d are needed to meet demand to 2010.
Supply • Realistic estimates for new additions are 6-8 mmb/d. • Even the most optimistic forecasts (CERA) are for 11.5 mmb/d additions. • Demand forecasts are 27.5 mmb/d…
The Oil Price Model: Assumptions • Central America will continue supply growth linearly. • Asia will continue to have problems getting its oil to world supply. • Africa will do very well increasing supply. • Middle East will increase ~3%/year, but will flood market after 2010. • Demand not seriously constrained by higher prices (some roll-off above $80/bbl). Once prices fall, demand is robust.
Valero Energy Corporation (NYSE:VLO) • Largest independent US refiner. Capacity of 3.3 mbd (crude throughput) is 19% of total US capacity. • High proportion of capacity is heavy/sour capable. This has allowed them to capture the spread between sweet/sour crude. • Most new reserves are sour. Is this a sustainable competitive advantage? • Extensive retail network allows them to capture retail margins which are less volatile than refining margins. • “Ideal” level of integration into pipelines and distribution networks.
Valero Energy Corporation • Management has demonstrated excellence in managing growth through organic projects and timely acquisitions. • Refining margins should remain strong through 2010 • Little to no excess capacity. No new refineries expected soon. • Has also shown fiscal discipline by being willing to walk away from projects.
VLO: Modeling Assumptions • Revenue: used Oil Price Model (R2=.9586, p-value < 7*10-16) • CoGS: depends on refining margins (which in themselves depend on the price of oil), but presence of retail operations smooth out fluctuations in margins. • CapEx: tracks revenues closely (based on historical data for VLO and examination of peer group). Will be no large CapEx outlay for new refineries. Expenditures will continue as in the past for upgrading refineries to heavy/sour and to comply with EPA restrictions. • Capital Structure: less borrowing in “good years”. • Margins are very volatile through 2010. Refinery margins increase above historical highs (not above current 2006 numbers) for the supply-constrained periods. Margins get hit hard when new supply comes on-line after 2010. • 9.51% discount rate. 5% terminal growth rate.
Strengths Largest independent US refiner. Large capacity for sour crude. Expanding that capacity. Good financials. Strong management. Performance will be tightly correlated to energy prices. Risks Operational risks: fires, shutdowns. Regulator risks: EPA. Highly volatile earnings. Performance will be tightly correlated to energy prices. VLO: Summary of Strengths and Risks
VLO: Summary Recommendation • Buy a large position. This is the major directional play for the sector. • Not for the faint of heart. Possibility of 4-6 month pull back and expect a wild ride! • Potential for large gains outweigh the risks. • Position size will be determined by sector weighting.
Outline • Objectives, Philosophy, Process– Jeremy • Program Enhancements • Website – Ramya • New York Trip – Autumn • RISE Conference – Brad • Sample Stock Report – Adam • SIM Fiscal YTD Performance – Jeremy
Performance of the SIM Program 2007 Press Coverage: Ohio State's Student Investment Portfolio: A picture of perfect timing Business First - March 9, 2007 by Brent LaLonde Money management class keeps Ohio State endowment funds safe Business First - January 5, 2007 by Doug Buchanan They Give It the Old College Try: Funds Let Students Invest Millions The Wall Street Journal- July 14, 2006 by Diya Gullapalli
Performance of the SIM Program 2007 Presentations: Neil Legacy Luncheon Presented by SIM Program – May 5, 2007 Fifth Third Bank Presented by Prof. Andrew Karolyi - March 14, 2007 The Ohio State University Alumni Leaders Conference Presented by Prof. Andrew Karolyi, Jeremy Sell and Adam Grimes - October 6, 2006
Performance of the Fund *Period ending April 30, 2007 **w/o Spring 2007 trades
Performance of the Fund Calculated based on period ending April 30, 2007
Performance of the Fund – Cont. SIM Total Value > $25 Million
Performance of the Fund – Fiscal YTD Monthly Returns Comparison 9 out of 10!
Performance of the Fund – Fiscal YTD Sector Attribution Analysis – Q1 • Overweight: • Information Technology - 2.35% • Health Care - 1.50% • Underweight: • Utilities - (2.30%) • Consumer Discretionary - (1.50%) • Materials - (1.30%) * Purchased 11/30/2006
Performance of the Fund – Fiscal YTD Sector Attribution Analysis – Q2 • Overweight: • Health Care – 5.42% • Telecom – 2.50% • Underweight: • Utilities - (2.20%) • Consumer Staples – (2.10) • Consumer Discretionary - (2.00%) * Purchased 11/30/2006
Performance of the Fund – Fiscal YTD Sector Attribution Analysis – Q3 • Overweight: • Health Care – 5.00% • Telecom – 4.00% • Underweight: • Consumer Discretionary - (2.75%) • Consumer Staples – (2.50) • Utilities - (2.10%) * Purchased 11/30/2006
Performance of the Fund – Fiscal YTD Stock Attribution Analysis
Performance of the Fund – Fiscal YTD Stock Attribution Analysis * Purchased 11/30/2006
Performance of the Fund – Fiscal YTD Stock Attribution Analysis * Purchased 11/30/2006
Performance of the Fund – Fiscal YTD Stock Attribution Analysis Closed $140 on 5/23 * Purchased 11/30/2006
Current Position: Portfolio Summary *Period ending April 30, 2007
Current Position: Stock Allocation *Period ending April 30, 2007
Current Position: Stock Allocation *Period ending April 30, 2007