Download
1 / 27
270 likes | 275 Vues
A review of Typhoon Sinlaku and the activities of the Joint Typhoon Warning Center in 2008, including tropical cyclone analysis, forecasting, and warning support. The report also includes satellite and microwave fixes, track errors, model errors, and intensity errors.

E N D
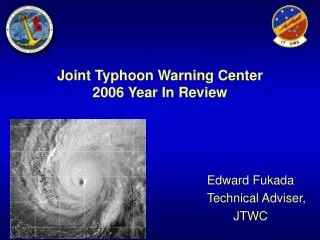
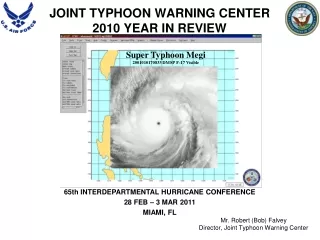
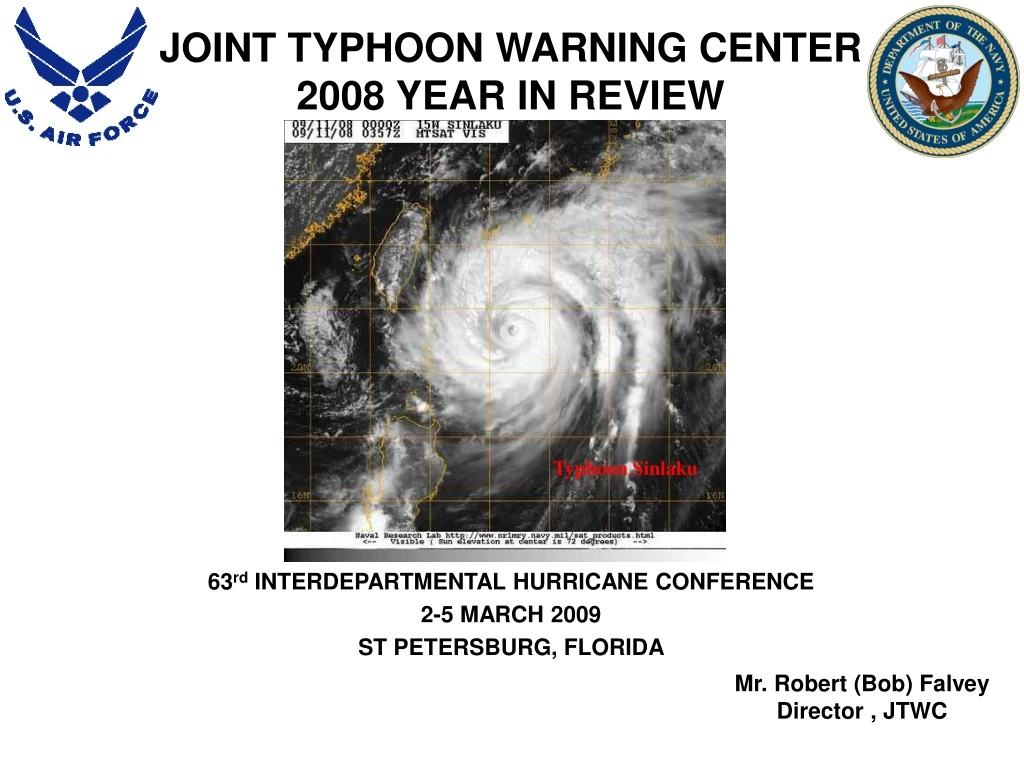
JOINT TYPHOON WARNING CENTER 2008 YEAR IN REVIEW Typhoon Sinlaku 63rdINTERDEPARTMENTAL HURRICANE CONFERENCE 2-5 MARCH 2009 ST PETERSBURG, FLORIDA Mr. Robert (Bob) Falvey Director , JTWC
MISSION Provide tropical cyclone analysis, forecast and warning support for Department of Defense, and other US Government assets in the Pacific and Indian Oceans as established by Commander, United States Pacific Command.
JTWC AOR Tokyo 33% CPHC NHC New Delhi 8% 17% Reunion Australia 13% Fiji 7% 11%
TC ACTIVITY Arabian Sea & Bay of Bengal 2004: 2005: 7 2006: 5 2007: 6 2008: 7 25 Yr avg: 5 NW Pacific 2004: 32 2005: 25 2006: 26 2007: 27 2008: 27 25 Yr avg: 31 C Pacific 2004: 2 2005: 1 2006: 4 2007: 2 2008: 1 25 Yr avg: 5 NE Pacific 2004: 16 2005: 16 2006: 21 2007: 15 2008: 18 25 Yr avg: 19 5 South Pacific 2004: 2 2005: 6 2006: 4 2007: 8 2008: 8 25 Yr avg: 6 S Indian Ocean & Australia Region 2004: 25 2005: 20 2006: 19 2007: 16 2008: 21 25 Yr avg: 23 4
SATELLITE RECON FIXES BY AGENCY 2008 Station Fixes (All Agencies) 0% 0% 1% 1% 0% 1%2% 0% 16% 113 1951 343 6% 744 86 9199 94 41 93 73% 42 (Total: 12,581) PGTW RJTD KNES PHFO FMEE NFFN ABRF ADRM APRF DEMS NZKL
SATELLITE RECON FIXES BY JTWC 2008 All Sensor Fixes (PGTW Only) (Total: 9,199) 3% 0% 8% 27% 5% 4% 7% 9% 16% 1% 19% 0% MTSAT SSMIS MET7 WIND GOES11 QSCT FY WSCT AMSU ASCT SSMI DMSP MMHS NOAA AMSR MODIS TRMM
SATELLITE RECON MICROWAVE FIXES BY JTWC Total Microwave Fixes: 4,639 (>50% of total) 5% 284 16% 34% 781 1716 AMSU SSMI MMHS AMSR TRMM SSMIS WIND 453 364 869 644 9% 7% 17% 12%
2008 WESTPAC TRACKS 14 Tropical Storms 11 Typhoons 2 Super Typhoons
2008 JTWC TRACK ERRORS ALL BASINS 500 450 400 350 300 Error (nm) WESTPAC NIO SH 250 200 150 100 50 0 12 24 36 48 72 96 120 Forecast Tau
JTWC TRACK ERRORS (WESTPAC - 24-72 Hours) 500 24 Hour 5 Year Ave 450 48 Hour 5 Year Ave 72 Hour 5 Year Ave 400 24 Hr 48 Hr 72 Hr 2004 69 121 162 2005 63 104 169 2006 64 106 151 2007 61 100 147 2008 66 Goal 50 100 150 350 300 Error (nm) 120 198 250 200 150 100 50 0 1974 1975 1976 1977 1978 1979 1980 1981 1982 1983 1984 1985 1986 1987 1988 1989 1990 1991 1992 1993 1994 1995 1996 1997 1998 1999 2000 2001 2002 2003 2004 2005 2006 2007 2008 Year
2008 WPAC ERRORS STORM BY STORM 350 300 250 Mean Error (nm) 200 24 Hour 48 Hour 72 Hour 150 100 50 0 1 2 3 4 5 6 7 8 9 10 11 12 13 14 15 16 17 18 19 20 21 22 23 24 25 26 27 Storm Number
JTWC TRACK ERRORS (WESTPAC - 96-120 Hours) 500 96 Hour 5 Year Ave 450 120 Hour 5 Year Ave 400 350 300 Nautical Miles 250 200 96 Hr 120 Hr 2004 206 275 2005 212 263 2006 216 309 2007 187 214 2008 301 Goal 200 250 150 100 447 50 0 2000 2001 2002 2003 2004 2005 2006 2007 2008 Year
2008 WPAC ERRORS STORM BY STORM 900 800 700 600 Mean Error (nm) 500 96 Hour 120 Hour 400 300 200 100 0 1 2 3 4 5 6 7 8 9 10 11 12 13 14 15 16 17 18 19 20 21 22 23 24 25 26 27 Storm Number
2007 MODEL ERRORS (WESTPAC – Homogeneous) 700 650 600 550 500 450 JTWC CONW GFS UMKO ECMWF GFDN NGPS 400 Error (nm) 350 300 250 200 150 100 50 0 12 24 36 48 72 96 120 (111) (93) (85) (74) (54) (29) (13) Forecast Tau
2008 MODEL ERRORS (WESTPAC – Homogeneous) 700 650 600 550 500 450 JTWC CONW GFS UMKO ECMWF GFDN NGPS 400 Error (nm) 350 300 250 200 150 100 50 0 12 24 36 48 72 96 120 (115) (101) (91) (76) (48) (27) (13) Forecast Tau
MODEL ERRORS Typhoon FengShen (7W)
MODEL ERRORS Typhoon FengShen (7W)
MODEL ERRORS Typhoon FengShen (7W) 10% of the JTWC 120 hour track error due to 07W
2007- 2008 ERROR DELTA (WESTPAC – Homogeneous) Homogeneous Skill Change (2007-2008) 100 50 0 12 24 36 48 72 96 120 -50 -100 JTWC CONW GFS UKMO ECMWF GFDN NGPS Error (nm) -150 -200 -250 -300 -350 -400 -450 Forecast Tau
Mean 1000mb WINDS Jun-Nov 1950-2008 Well Defined Monsoon Trough
2008 1000mb WINDS Jun-Nov08 Lack of Westerlies N-S Monsoon Trough
JTWC INTENSITY ERRORS (WESTPAC 24 - 120 Hours) 24 Hr 48 Hr 72 Hr 96Hr 120Hr 2004 11 17 21 23 26 2005 12 18 24 25 25 2006 13 17 20 22 24 2007 13 18 20 24 26 2008 12 19 21 22 28 35.0 24 Hr 48 Hr 72 Hr 96 Hr 120 Hr 30.0 25.0 Error (kts) 20.0 15.0 10.0 5.0 0.0 1987 1989 1990 1991 1992 1993 1994 1995 1996 1997 1998 1999 2000 2001 2002 2003 2004 2005 2006 2007 2008 Year
ITEMS OF INTEREST • USAF Civilianization (Update) • MARK IVB DRO Continuation/Expansion • Fix Bulletin Changes (Unified DoD/NOAA format, MI fixes included) • T-PARC / TCS-08 – Data used in forecasts (Sinlaku) • JMA GSM out to 132 Hrs / Forecasts to 120 Hrs • ECMWF Fields • METSAT Conference / Tropical Cyclone Conference / JTWC 50thAnniversary – METSAT: 27-28 Apr – JTWC 50thAnniversary: 29 Apr 1000 HST – TCC: 29 Apr – 1 May
Contact Info • Director: robert.falvey@navy.(smil).mil COM: (808) 474-5301 DSN: (315) 474-5301 • JT Ops Officer (JTOPS): michael.vancas@navy.(smil).mil COM: (808) 471-4597 DSN: (315) 471-4597