Download
1 / 38
390 likes | 532 Vues
Introduction of KMA statistic model and ensemble system. Korea Meteorological Administration Numerical Weather Prediction Division Joo-Hyung Son. PPM (Perfect Prognostic Method) Daily Max/Min and midnight temperature Probability of Precipitation MOS (Model Output Statistics)

E N D
Introduction of KMA statistic model and ensemble system Korea Meteorological Administration Numerical Weather Prediction Division Joo-Hyung Son
PPM (Perfect Prognostic Method) Daily Max/Min and midnight temperature Probability of Precipitation MOS (Model Output Statistics) Digital Forecast KF(Kalman Filtering)/DLM(Dynamic Linear Model) Daily Max/Min Temperature 3 hourly temperature Daily Max/Min Temperature of 10 days Statistical models
Statistical models Max/Min Temp PoP PPM PPM RDAPS KF Max/Min Temp KF DLM 3hr Temp RDLM GDAPS Max/Min Temp DLM GDLM
Predictant 00 UTC : +1(00UTC, Max/Min) 12UTC : +1(Max), +2(00UTC, Min) Forecast regions 70 sites in Korea Model development May 1, 1988 – Feb 28, 1992 (4 years) Regional reanalysis of JMA Climate data of 70 weather sites PPM for Max/Min Temp
PPM Model structure for Max/Min Temp Forecast equation Temp (t) = A + B*obs(0) + {Ci*model predictori(t)} A, B, Ci (i=1,2,…,n): fixed coefficients predictor predictor 1000, 850, 700,500,400,300hPa Wind speed, direction, Temperature Dewpoint temp, Height et al. from RDAPS Observation, climate Forecast eqs for each season, sights predictant Max/Min and 00LST temperature of 70 sights Predictant
PPM Predictors • select a group of predictors which explain predictant(temperature) well from 44 predictors <method: forward-backward selection> • the number of the predictors of each seasonal and regional forecast equations are ranged from 5 to 10 • OBS: observation, CLMT: climate, PCWT: virtual prediction, VOR: vorticity, TAD: temperature advection, KYID: KY index
PPM Model structure for PoP Forecast equation Temp (t) = A + B*obs(0) + {Ci*modeli(t)} A, B, Ci (i=1,2,…,n): fixed coefficients predictor predictor 1000, 850, 700,500,400,300hPa Wind speed, direction, Temperature Dewpoint temp, Height et al. from RDAPS Observation, climate Forecast eqs for Each region according to warm and cold season predictant PoP of 18 regions Predictant
PPM Predictors • PoP • the number of sites observed precipitation in the region • Total number of sites in the region • 18 regions : • 24 region by cluster analysis • (Moon(1990)) • + forecast experiment • the forecast equations are developed according to the warm(April-September) and cold(October-March) season and each regions. • 18 regions for forecast of PoP
Predictant 00 UTC : +1(Min/Max), +2(Min) 12 UTC : +1(Max), +2(Min/Max) Forecast regions 40 in Korea, 32 in North Korea, China, Japan KF for Max/Min Temp
Kalman Filter algorithm KF for Max/Min Temp vt~N(0,Vt): observation noise wt~N(0,Wt) : process noise Gt = 1 V0 = 2 4/365 0 0 W0= 0 1/365 0 0 0 1/365 1 Ft = RDAPS Latest Obs temp
DLM(Dynamic Linear Model) • DLM • Improved Kalman Filter algorithm • Weights(regression coefficient) are modified according to the prior condition with time.
DLM DLM(Dynamic Linear Model) vt~N(0,Vt) wt~N(0,Wt) • Use the updating algorithm to estimate Wt with time • Find appropriate Wt increasing discount factor(0<delta<1) from 0.01 to 1 with interval 0.01 • the discount factor is selected when RMSE between observation and forecast is the lowest
RDLM(Regional DLM) 3hourly forecast up to 48hr RDAPS 38 sites GDLM(Global DLM) Max/Min temp for 10 days GDAPS 38 sites DLM(Dynamic Linear Model)
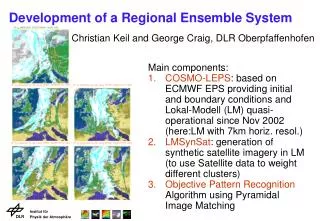
Breeding Pert. run AnalysisD+Perturbation normalization Control run AnalysisD AnalysisD+1 Schematic diagram • The global spectral model T106L30 with the slightly different initial conditions run 17 times. • Both perturbed analysis and control analysis are projected to 24hours with the model, and departures from the control analysis at +24hours are scaled down to the norm of initial perturbations
Breeding + Rotation AnalysisD+Perturbation Pert. run normalization Control run AnalysisD+1 AnalysisD Rotation Rotation Schematic diagram D+1 day D day D day + 12hr D+1 day +12hr • 17members could be similar each other because they are generated from the identical model, so this is to make different perturbation among the members manually. • In the new system, the factor rotation was added every alternative step.
2005. 6. 11 old(cray-before) NEW (cray-frot)
2005. 6. 11 old(cray-before) NEW (cray-frot)
mean and spread • spaghetti • stamp map • categorical PoP • probability of Surface Max Wind • time series of probability EPS products (http://190.1.20.56)
Spaghetti ( with ensemble spread) 5520m 5640m
Stamp map • display the global model, mean and standard deviation and spaghetti as well as each member.
12-hour precipitation > given thresholds : 1, 5, 10mm for winter season : 1, 10, 50mm for other seasons The probability These probability maps are used for the early warning guidance of severe weather. Categorical PoP
Surface maximum wind > 10m/s, 14m/s The probability These probability maps are used for the early warning guidance of severe weather. Probability of Surface Max Wind
Precipitation Sfc Max Wind Time series of Probability • Precipitation 12hr accumul >=1mm 12hr accumul >= 10mm 12hr accumul >= 50mm • Surface Max Wind sfc wind >= 10m/s sfc wind >= 14m/s • Principle cities Seoul, Daegu, Daejeon Busan et al.
Largest value Upper quartile Median Lower quartile Smallest value Interpretation of boxplots Image of PDF Time series of primary cities EPSgram
Ensemble Plumes Time series of 8-day forecast at cities The dispersion of members with forecast evolution Variable : Pmsl, 500H, 850 T
Factor analysis • Factor analysis • Factor analysis is a statistical technique to explain the most of the variability among a number of observable random variables in terms of a smaller number of unobservable random variables called factors • Factor rotation • Factor rotation is to find a parameterization in which each variable has only a small number of large loadings. That is, each variable is affected by a small number of factors, preferably only one. This can often make it easier to interpret what the factors represent.