Download
1 / 52
520 likes | 610 Vues
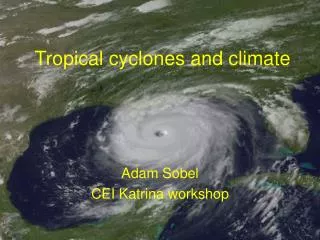
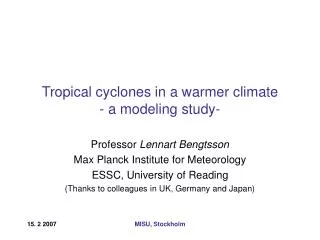
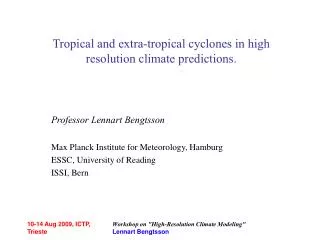
Tropical cyclones in a warmer climate - a modeling study-. Professor Lennart Bengtsson Max Planck Institute for Meteorology ESSC, University of Reading (Thanks to colleagues in UK, Germany and Japan). Tropical Cyclones in a warmer climate.

E N D
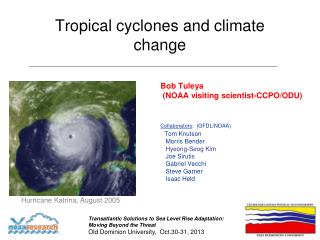
Tropical cyclones in a warmer climate- a modeling study- Professor Lennart Bengtsson Max Planck Institute for Meteorology ESSC, University of Reading (Thanks to colleagues in UK, Germany and Japan) WMO, Geneva
Tropical Cyclones in a warmer climate • Societal damages are to a large extent related to extreme weather mostly in association with tropical and extra-tropical cyclones • The cost for hurricane Katrina is estimated to some 200 G$ • There are many examples of great loss of life due to extreme tropical cyclones. • Damages are mostly related to high winds, flooding due to the high precipitation and in coastal areas to high sea-level and waves. • The question whether cyclones may intensify in a future climate is consequently an issue of primary importance for society. • This is further enhanced by the ongoing increased exposure to extreme weather independent of climate change. WMO, Geneva
Tropical cyclones in a future climatewhat could be expected? • Higher SST and higher atmospheric moisture would generally favor more intense storms ( e.g. Emanuel 1988, 1999) • This is supported by modeling results by Knutson and Tuleya (2004) driving an limited area model with CMIP2+ boundary data ( 9 different models). • Increasing vertical wind-shear and reduced relative humidity would counteract this tendency. Such influences occur in the tropical N. Atlantic during El Nino. • Some GCM indicate reduced number of cyclones in a warmer climate • How will the number of storms change? What are the general conditions controlling the number of tropical storms? • What are the critical conditions in modeling tropical storms? Are results from large scale models with limited resolution credible? WMO, Geneva
The Carnot cycle concept After Emanuel WMO, Geneva
Modeling approach • Direct simulation of tropical cyclones in a global GCM • Using limited area models at high resolution • Identifying climate predictors in a GCM (SST, vorticity, static stability, relative humidity, vertical wind-shear) WMO, Geneva
Simulation of tropical cyclones with a GCM • Typical criteria: • An identifiable vortex ( often at 850 hPa) • A minimum in the surface pressure • Surface wind speed above a given value (> 18m/s) • A warm core vortex ( reduced circulation with height) WMO, Geneva
Direct simulation of tropical cyclones in a global GCM • Disadvantage: Difficulties to resolve the intense features of a tropical storm • Examples of studies: Bengtsson et al. 1995, 1996, Tellus Sugi et al. 2002, JMS, Japan McDonald et al. 2005, Clim.Dyn. Chauvin et al. 2006, Clim Dyn. Oouchi et al. 2006, JMS, Japan Yoshimori et al. 2006, JMS, Japan WMO, Geneva
Effect of 2xCO2 From Bengtsson et al., 1996 (Tellus) ( number of cyclones /basin) WMO, Geneva
Using limited area models at high resolution • Disadvantages: Generation of storms, Large scale influences difficult to handle • Examples of studies: Knutson et al. 1998, Science Knutson and Tuleya, 1999, Clim. Dyn. Knutson and Tuleya, 2004, J Clim. WMO, Geneva
Impact of CO2-induced warming on simulated hurricane intensityKnutson and Tuleya (2004, J of Climate) • They used a high resolution limited area model driven by the SST and moisture of 9 CGCM from the CMIP 2+ project. • CMIP2 uses 1%yr-1 increase over an 80-year period implying an increase by a factor of 2.2. • Model calculations are undertaken in NW Pacific-, NE Pacific- and Atlantic basin • Four different convective schemes are tested (no significant differences) • RESULTS: • Max. surface wind speed increases by 6% • Min. central pressure by 14% • Max. precipitation by 24% • Hurricane increase by a factor of 1/2 in the Simpson-Saffir scale WMO, Geneva
Intensification of hurricanes at 2xCO2Knutson and Tuleya (2004) WMO, Geneva
Identifying climate predictors in a GCM • Disadvantage: Lack of proper understanding, ad hoc selection of predictors, overestimation of the effect of SST • Examples of studies Gray, 1979 Met. over the Tropical oceans, RMetSoc Royer et al. 1998, Clim. Change Chauvin et al. 2006, Clim. Dyn. WMO, Geneva
Objectives of the present studyTropical cyclones (TC) in ECHAM5 in the Northern Hemisphere(Using high global resolution) How do the TCs respond to anthropogenic climate change and how does this depend on resolution? What changes occur in intensity, life time and power dissipation index? What possible mechanisms control the change in TC? What are the dominant factors? WMO, Geneva
Tracking methods and vortex identification • Tracks are followed from its generation (6x10⁻⁶s-1) until it disappears as an extra-tropical cyclones north of 60N • We calculate the total life-time of the TCs • We are able to identify the transition from a tropical to an extra-tropical vortex • Alternatively we use the wind speed at 925 hPa as a selection criteria for intense storms • We have also calculated the potential dissipation index, PDI. See Emanuel, Nature, 2005 WMO, Geneva
Hurricane Katrina August 2005ECMWF operational analyses, 850 hPa vorticity WMO, Geneva
Katrina vorticity at different levels WMO, Geneva
Selection of TC indicators • We use criteria for minimum vorticity at 850 hPa (V), minimum vertical vorticity gradient (G) between 850 and 250 hPa, and number of time steps of 6 hrs (T) when these conditions are fulfilled. • (V, G, T) = (6, 6, 4) vorticity at 850 hPa = 6x10⁻⁵s-1 vorticity 850- 250 hPa = 6x10⁻⁵s-1 conditions fulfilled at least 24 hrs (6, 6, 4) is defined as a TC WMO, Geneva
All Tropical Storms Hurricanes, Typhoons, Cyclones >33ms-1 (6, 6, 4) (10, 6, 4) (12, 6, 4) 2003 75 33 71 48 39 2004 72 36 79 52 41 2005 80 38 83 62 48 Selection of criteria for selecting tropical storms (TC)(using ECMWF operational analyses) WMO, Geneva
Intensity v Speed (T213) WMO, Geneva
Objectives of the present studyTropical cyclones in ECHAM5 • We have used scenario A1B and studied the periods 1861-1890, 1961-1990 and 2071-2100 • We have explored the coupled T63 run (3 runs) for all periods and • T213 time - slice 1961-1990 and 2071-2100 • T319 time - slice 1971-1990, (2080-2100) • We have also used AMIP2 runs (20 years) with T63 and T159 as a validation study WMO, Geneva
Comparison with observations from the Tropical Warning Centers and with ERA-40 re-analyses WMO, Geneva
Super Typhoon 21 (1991) in ERA-40 (left)and selected similar storm in ECHAM5 (right)Intensity (vorticity at 850 hPa) WMO, Geneva
Lifetime of TCs in days WMO, Geneva
Hurricane genesis (a) observed, (b) ERA-40 and (c ) ECHAM5 T159 WMO, Geneva
Hurricane track density(a) observed, (b) ERA-40 and (c ) ECHAM5 T159 WMO, Geneva
Hurricane track density (Atlantic)(d) observed, (e) ERA-40 and (f ) ECHAM5 T159 WMO, Geneva
Are there observational evidence that tropical cyclones are becoming more intense? Why is it so difficult? • Longer term records are needed due to internal variability • There have been large changes in the observing systems making it easier to detect more tropical cyclones in later years. • Recent papers have used PDI ( time integral of max. wind cube) which is overly sensitive to observational accuracy • Model studies (e.g. Knutson and Tuleya, 2004) indicate small changes in intensity as of now which are hardly detectable WMO, Geneva
Are there observational evidence that tropical cyclones are becoming more intense? • YES • Webster et al. (2005), Science, Emanuel (2005), Nature, Sriver and Huber (2006), GRL • NO • Chan (2006), Science, Klotzbach ( 2006), GRL, Landsea et al. (2006), Science WMO, Geneva
There are recent claims that there is an increase in hurricane intensity ( e.g. Emanuel (2005), Webster et al. (2005) • Are these findings credible? • They are generally not supported by operational meteorologists • According to Knutson and Tuleya (2004) any changes are probably undetectable“for decades to come” • There are structural problems in the detection of trends • Changes in observing systems • Difficulties to separate a genuine change in storms from societal causes behind the huge increase in damages and damage cost WMO, Geneva
What may happen in a warmer climate?A modeling approach We have used the AIB scenario And the coupled MPI model at T63 resolution used in the IPCC 4th assessment Higher resolution experiments use the transient SST from T63 (time - window) We study C20 (1961- 1990) C21 ( 2071-2100) WMO, Geneva
What is A1B? • Middle of the line scenario • Carbon emission peaking in the 2050s (16 Gt/year) • CO2 reaching 450 ppm. in 2030 • CO2 reaching 700 ppm. in 2100 • SO2 peaking in 2020 then coming done to 20% thereof in 2100 WMO, Geneva
SST difference (C 21-C 20) WMO, Geneva
TCs at T63 resolution C19 (black), C20 (red) and C21(blue) WMO, Geneva
Hurricane genesis T213From top C21-C20, C21 and C20 WMO, Geneva
Hurricane track density, T213From top C21-C20, C21 and C20 WMO, Geneva
T213 T213 All (6, 6, 4) >18ms-1 >2x10⁻⁴ s-1 >33ms-1 >5x10⁻⁴ s-1 >50ms-1 >1x10⁻³ s-1 20C (1961-1990) 20C (1961-1990) 104 100 97 33 40 3.7 6.0 21C (2071-2100) 21C (2071-2100) 94 92 90 36 4.9 49 9.8 Number of TCs/year (T213) for C 20 and C21 for wind speed and vorticity WMO, Geneva
Changes of TCs in four NH regions (T213) WMO, Geneva
Change in TC lifetime (T213) WMO, Geneva
Change in min. surface pressure (T213) C21 C20 WMO, Geneva
Accumulated precipitation ( in mm and for an area with a radius of 5 degrees) along the track of the TCs for C20 and C21(T213)HTVs reaching >33ms-1 C20 C21 Total increase 30% WMO, Geneva
Climate change and the water cycle • Atmosphere appears to conserve relative humidity. This means that atmospheric water vapor follows Clausius- Clapeyron relation. (Soden and Held, 2006, J. Clim.) • We see an increase of 27% in atmospheric water vapor at C21 compared to C20 • Precipitation must be balanced by evaporation. Evaporation is driven by the surface energy balance which increases slower than atmospheric water vapor. In fact it can even diminish at a high aerosol concentration (ECHAM4). • Precipitation increases by 6% both globally and in the tropics • This means that the residence time of water in the atmosphere increases from 8.7 to 10.3 days or by 16%. WMO, Geneva
Result from present study:Reduced number of hurricanes • There is s reduction in the number of tropical cyclones in agreement with most previous studies. • We suggest this is due to a weakening of the tropical circulation. This can best be seen as a slowing down of the hydrological cycle by some 16% • The radiative cooling of the tropics increases due to more water vapor in the upper troposphere and dynamical cooling due to increased static stability. This processes can compensate warming from release of latent heat (6%) with a less active tropical circulation. WMO, Geneva
Result from present study:More intense hurricanes • Given favorable atmospheric condition we suggest the ideas put forward by Emanuel and Holland comparing a hurricane with a Carnot cycle can be applied. • This will provide an energy input broadly proportional to the specific humidity at a higher temperature (following SST) • The intensification of the tropical cyclones depends on sufficient model resolution to accurately describe the convergence of momentum which generate the very high wind speeds at the core of the vortex. • For TCs reaching 33ms-1 PDI (power dissipation index) increase by 16% WMO, Geneva
Why do we see a reduced number of tropical cyclones in a warmer climate? • We suggest the following mechanism • There is a reduction in the large-scale tropical circulation at climate warming due to increased static stability and a rapid increase in the amount of water vapor in the atmosphere. • This generally leads to less favorable conditions to generate organized onset vortices which are seen as key atmospheric conditions for the generation of tropical storms. WMO, Geneva
Why do we see an intensification of the tropical storms in a warmer climate? • We suggest the following process • Due to chance favorable conditions are likely to evolve • In such situations the mechanisms proposed by Emanuel may be applied, that means that the maximum wind speed is proportional to the sqr. of the available latent energy provided to the storm • To demonstrate this with a GCM requires sufficient resolution ( say 50-100 km or less) WMO, Geneva
What is the effect of even higher resolution? 20-year simulation at T319 resolution WMO, Geneva
A model generated storm in the T319 experiment WMO, Geneva
Wind, vorticity and surface pressurefor the same model storm WMO, Geneva
TCs at C20 at four different resolutionsNumber/year as a function of vorticity WMO, Geneva
T319 Intensity changes 20C to 21C WMO, Geneva