Download
1 / 8
80 likes | 143 Vues
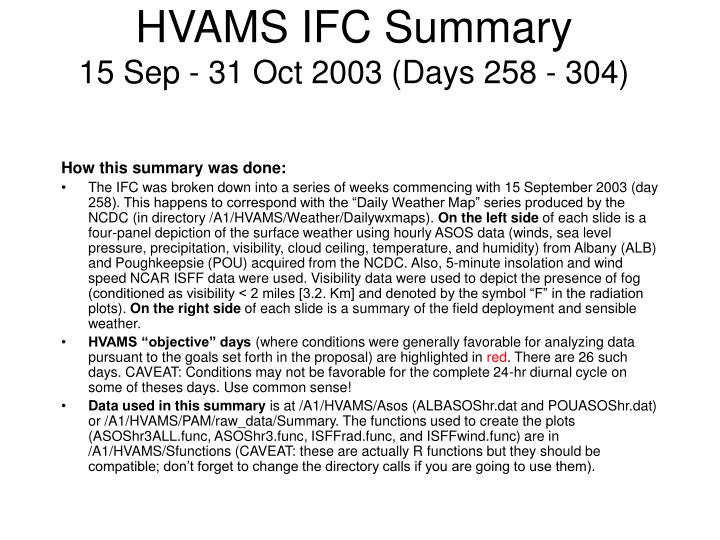
HVAMS IFC Summary 15 Sep - 31 Oct 2003 (Days 258 - 304). How this summary was done:

E N D
HVAMS IFC Summary15 Sep - 31 Oct 2003 (Days 258 - 304) How this summary was done: • The IFC was broken down into a series of weeks commencing with 15 September 2003 (day 258). This happens to correspond with the “Daily Weather Map” series produced by the NCDC (in directory /A1/HVAMS/Weather/Dailywxmaps). On the left side of each slide is a four-panel depiction of the surface weather using hourly ASOS data (winds, sea level pressure, precipitation, visibility, cloud ceiling, temperature, and humidity) from Albany (ALB) and Poughkeepsie (POU) acquired from the NCDC. Also, 5-minute insolation and wind speed NCAR ISFF data were used. Visibility data were used to depict the presence of fog (conditioned as visibility < 2 miles [3.2. Km] and denoted by the symbol “F” in the radiation plots). On the right side of each slide is a summary of the field deployment and sensible weather. • HVAMS “objective” days (where conditions were generally favorable for analyzing data pursuant to the goals set forth in the proposal) are highlighted in red. There are 26 such days. CAVEAT: Conditions may not be favorable for the complete 24-hr diurnal cycle on some of theses days. Use common sense! • Data used in this summary is at /A1/HVAMS/Asos (ALBASOShr.dat and POUASOShr.dat) or /A1/HVAMS/PAM/raw_data/Summary. The functions used to create the plots (ASOShr3ALL.func, ASOShr3.func, ISFFrad.func, and ISFFwind.func) are in /A1/HVAMS/Sfunctions (CAVEAT: these are actually R functions but they should be compatible; don’t forget to change the directory calls if you are going to use them).
HVAMS Summary: Week 1 (9/15 - 9/21)* *A limited number of surface stations were operating prior to 9/15