Download
1 / 15
160 likes | 294 Vues
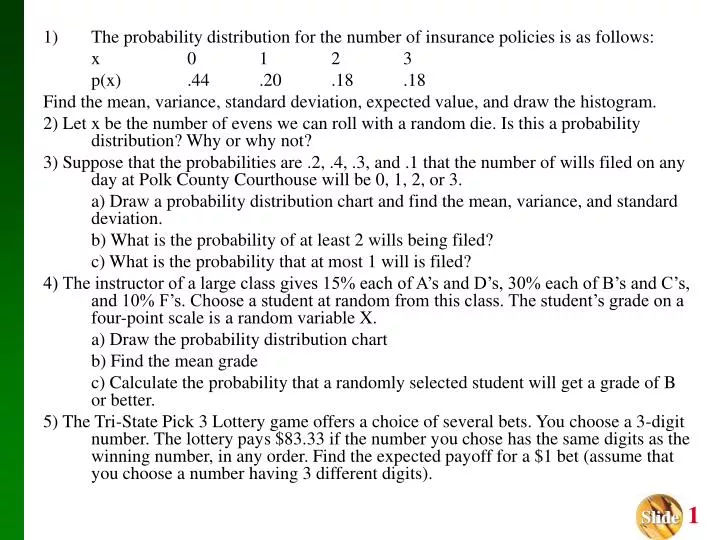
The probability distribution for the number of insurance policies is as follows: x 0 1 2 3 p(x) .44 .20 .18 .18 Find the mean, variance, standard deviation, expected value, and draw the histogram.

E N D
The probability distribution for the number of insurance policies is as follows: x 0 1 2 3 p(x) .44 .20 .18 .18 Find the mean, variance, standard deviation, expected value, and draw the histogram. 2) Let x be the number of evens we can roll with a random die. Is this a probability distribution? Why or why not? 3) Suppose that the probabilities are .2, .4, .3, and .1 that the number of wills filed on any day at Polk County Courthouse will be 0, 1, 2, or 3. a) Draw a probability distribution chart and find the mean, variance, and standard deviation. b) What is the probability of at least 2 wills being filed? c) What is the probability that at most 1 will is filed? 4) The instructor of a large class gives 15% each of A’s and D’s, 30% each of B’s and C’s, and 10% F’s. Choose a student at random from this class. The student’s grade on a four-point scale is a random variable X. a) Draw the probability distribution chart b) Find the mean grade c) Calculate the probability that a randomly selected student will get a grade of B or better. 5) The Tri-State Pick 3 Lottery game offers a choice of several bets. You choose a 3-digit number. The lottery pays $83.33 if the number you chose has the same digits as the winning number, in any order. Find the expected payoff for a $1 bet (assume that you choose a number having 3 different digits).
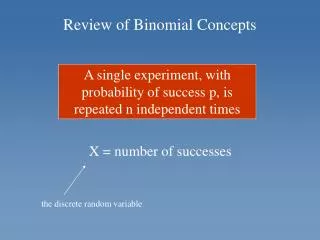
Section 5-3 Binomial Probability Distributions
Key Concept This section presents a basic definition of a binomial distribution along with notation, and it presents methods for finding probability values. Binomial probability distributions allow us to deal with circumstances in which the outcomes belong to two relevant categories such as acceptable/defective or survived/died.
Definitions A binomial probability distribution results from a procedure that meets all the following requirements: 1. The procedure has a fixed number of trials. 2. The trials must be independent. (The outcome of any individual trial doesn’t affect the probabilities in the other trials.) 3. Each trial must have all outcomes classified into twocategories (commonly referred to as success and failure). 4. The probability of a success remains the same in all trials.
Notation for Binomial Probability Distributions S and F (success and failure) denote two possible categories of all outcomes; p and q will denote the probabilities of S and F, respectively, so P(S) = p (p = probability of success) P(F) = 1 – p = q (q = probability of failure)
Notation (cont) n denotes the number of fixed trials. x denotes a specific number of successes in n trials, so x can be any whole number between 0 and n, inclusive. p denotes the probability of success in one of the n trials. q denotes the probability of failure in one of the n trials. P(x) denotes the probability of getting exactly x successes among the n trials.
When sampling without replacement, consider events to be independent if n < 0.05N. Important Hints • Be sure that x and p both refer to the same category being called a success.
In the case of Castaneda v. Partida it was noted that although 80% of the population in a Texas county is Mexican-American, only 39% of those summoned for grand juries were Mexican-American. Let’s assume that we need to select 12 jurors from a population that is 80% Mexican-American, and we want to find the probability that among 12 randomly selected jurors, exactly 7 are Mexican-American. Does this procedure result in a binomial distribution? If this procedure does result in a binomial distribution, identify the values of n, x, p, and q. Example
Methods for Finding Probabilities We will now discuss three methods for finding the probabilities corresponding to the random variable x in a binomial distribution.
n! P(x) = •px•qn-x (n –x)!x! for x = 0, 1, 2, . . ., n Method 1: Using the Binomial Probability Formula where n = number of trials x = number of successes among n trials p = probability of success in any one trial q = probability of failure in any one trial (q = 1 – p)
Use the binomial probability formula to find the probability of getting exactly 7 Mexican-Americans when 12 jurors are randomly selected from a population that is 80% Mexican-American. That is, find P(7) given that n=12, x=7, p=0.8, and q=0.2. Example
Method 2: Using Table A-1 in Appendix A Part of Table A-1 is shown below. With n = 12 and p = 0.80 in the binomial distribution, the probabilities of 4, 5, 6, and 7 successes are 0.001, 0.003, 0.016, and 0.053 respectively.
Example 1) Use the portion of Table A-1 (for n=12 and p=0.8) to find the following: • The probability of exactly 7 successes • The probability of 7 or fewer successes. 2) You: Find the probability that among 12 jurors, the number of Mexican-Americans is • Exactly 10 • More than 10 • At least 10 • Fewer than 10
Method 3: Using Technology STATDISK, Minitab, Excel and the TI-83 Plus calculator can all be used to find binomial probabilities. STATDISK Minitab
Method 3: Using Technology STATDISK, Minitab, Excel and the TI-83 Plus calculator can all be used to find binomial probabilities. Excel TI-83 Plus calculator