Download
1 / 21
220 likes | 398 Vues
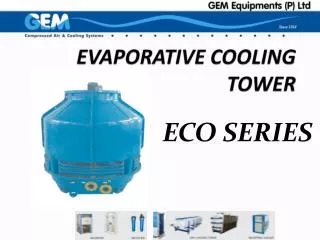
Challenger Center Cooling Tower. Enev/Ench 435 September 23, 2008 Performed By: Dianah Dugan Alex Saputa. Contents. Block Diagram Schematic Equipment Data Collection Results Conclusion. Block Diagram of Cooling Tower. Air Inlet. Air Outlet. CT unit. T h q P H. T P.

E N D
Challenger Center Cooling Tower Enev/Ench 435 September 23, 2008 Performed By: Dianah Dugan Alex Saputa
Contents • Block Diagram • Schematic • Equipment • Data Collection • Results • Conclusion
Block Diagram of Cooling Tower Air Inlet Air Outlet CT unit T h q P H T P
Cooling Tower Schematic Exhaust Outside Intake OutsideIntake Inside Intake
Schematic of Exhaust Fan 0.22 ft 0.72 ft 1.22 ft *Distances measured from center of fan
Equipment • Anemometer • Yard Stick • Ladder • Sling Psychrometer • Psychrometric Chart
Volumetric Flow • How to solve for with formulas and trapezoidal rule • Don’t forget results from expt 1
Volumetric Flow (cu. ft/min) • results
Humidity • Tell about relative humidity (data taken) • Absolute humidity being same in and out • RH from psychrometric chart • enthalpy
Mass Flow Rate *check density at exit temp Mf = (density)*(area)*(velocity)
Block Diagram • With values that have been solved for
Conclusions • Temperature is highest at the center of the fan and lowest surrounding the edges • Velocity is the least in the center of the exhaust