Download
1 / 35
350 likes | 358 Vues
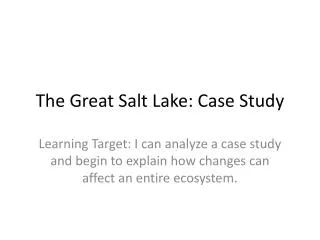
Salinity, Evaporation and the Rise and Fall of the Great Salt Lake. DAVID G. TARBOTON IBRAHIM N. MOHAMMED. Great Salt Lake Hydrology. Terminal lake with inflow from 3 major rivers to east. Only outflow is evaporation. L ake level and area fluctuates dynamically to adjust outflow to inflow.

E N D
Salinity, Evaporation and the Rise and Fall of the Great Salt Lake DAVID G. TARBOTON IBRAHIM N. MOHAMMED
Great Salt Lake Hydrology • Terminal lake with inflow from 3 major rivers to east. • Only outflow is evaporation. • Lake level and area fluctuates dynamically to adjust outflow to inflow. • Lake volume impacts salinity (dilution). • Salinity impacts evaporation (saturation vapor pressure) • Lake levels are important for infrastructure, industry and commerce near and on the lake
The availability of water to sustain life is perhaps the most recurrent constraint in human history and will remain so in the foreseeable future. From http://www.doi.gov/water2025/index.html
Strawberry Bear Weber Jordan/Provo West Desert The Great Salt Lake Basin A microcosm for many Western Water Issues
A microcosm for many "western" water issues • Climate Gradients (Snow fed, Alpine to semi-arid), variability and vulnerability • Topographic and Land Use Gradients • Mountain Front / Valley groundwater dynamics and interactions • Geologic Diversity (Granite to Karst) • Closed basin for water and constituent balance closure • Development issues (local growth, SLC metropolitan area demands) • Policy Issues (3 states) • Agricultural issues (water supply, environmental compliance) • Environmental Issues (water quality, watershed management practices) • Ecological issues (Stream ecosystems, Bird refuge, GSL ecosystem)
A common playground The Great Salt Lake Basin Critical Zone Observatory (Proposal submitted to NSF)
Overarching Questions • How do climate variability and human induced landscape changes influence hydrologic processes, water quality and availability and the functioning of ecosystems to determine the flux of water and chemicals in rivers, lakes and aquifers? • What are the resource, social and economic consequences of these changes? • The Great Salt Lake provides the opportunity for closure of mass and water balances in a unique way useful to address these questions
Great Salt Lake Levels (USGS data) SLC Airport level The lake was divided into North and South arms by a railroad causeway in 1959. Separate records of level in the North Arm and South Arm are available from 1966. Feet Meters 5/12/07 4197.4 ft 1279.4 m
Level-Area-Volume Relationships (Lovinget al., 2000) Level (meter) Level (meter) Area (km2) Volume (km3) Area (km2) Volume (km3)
Great Salt Lake Volumes • GSL was at its lowest water-surface elevation in recent history at about 1,277.4 m (4,191 ft), it covered about 2,460.5 km2 (950 mi2) and was about 7.6 m deep at its deepest point in 1963. • 1987, when Great Salt Lake was at its highest water-surface elevation at about 1,283.8 m (4,212 ft) on April 1st, 1987, it covered about 6,216 km2 (2,400 mi2) and was about 13.7 m at its deepest point. km3 Acre-Feet 107
GSL Level Volume Area Conceptual Model Processes that drive the GSL Volume fluctuations Solar Radiation Precipitation Air Humidity Air Temp. Mountain Snowpack Evaporation Soil Moisture And Groundwater Salinity Streamflow
Volume Increase & Decrease each Year June 15 - Nov 1 Nov 1 - June 15 V (+ or -) m3
SLC, Jordan/Provo River Drainage area 8,904 km2 Corrine, Bear River Drainage area 18,205 km2 Streamflow gages Provo, Provo River Drainage area 1,743 km2 Plain City, Weber River Drainage area 5,390 km2 Spanish, Jordan River Drainage area 1,689 km2
m3 Annual Streamflows 1600 Mm3/year 520 Mm3/year 126 Mm3/year USGS Data
Nov 1 - June 15 lake volume increase LOWESS (R defaults) 1:1 line ΔV+ (m3) Nov 1 - June 15 Annual total streamflow, Q (m3) Lake annual precipitation volume, P (m3)
LOWESS (R defaults) Great Salt Lake Evaporation from annual mass balance E = P+Q-V E m3 Area m2
LOWESS (R defaults) Evaporation vs Temperature (Annual) E/A m Degrees C
LOWESS (R defaults) Annual Evaporation Loss E/A Salinity decreases as volume increases. E increases as salinity decreases. E/A m Area m2
LOWESS (R defaults) Evaporation vs Salinity Salinity estimated from total load and volume related to decrease in E/A with decrease in lake volume and increase in C E/A m C = 3.5 x 10¹² kg/(Volume) g/l
LOWESS (R defaults) Volume decrease versus E (annual) 1:1 line • Significant E in excess of V-. • Evaporation not negligible when lake is rising (Nov 1 - June 15) • Streamflow input when lake is falling not negligible V-m3 June 15 -Nov 1 E m3 (from annual mass balance E = P+Q-V)
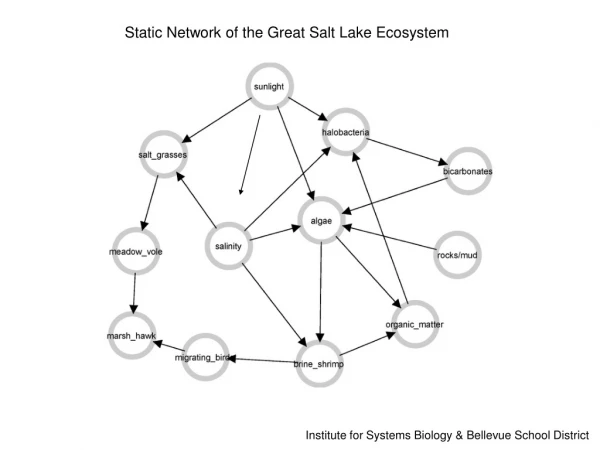
UGS Salinity Observation Sites Evaporation... LVG4 (North Arm) RD2 (North Arm) • Evaporation is the only outflow from the GSL, • Lake volume impacts salinity (dilution). • Evaporation from the GSL is sensitive to salinity which changes the saturation vapor pressure above the lake’s surface, • Salinity decreases as volume increases and visa versa. AS2 (South Arm) FB2 (South Arm)
GSL Level Volume Area Salinity & Evaporation within Overall System Solar Radiation Precipitation Air Humidity Air Temp. Mountain Snowpack Evaporation Soil Moisture And Groundwater Salinity Streamflow
Lake Surface Salinity West Desert Pumping Project (Apr 1987 - Jun 1989) North Arm TDS (g/l) Pre 1986 Post 1987 South Arm LOWESS Level (m)
Total Salt Load Calculations 0.152 m 0.0m 0.762m 1.524 m 2.286m 3.048 m 3.810m 6.096 m 6.858m 9.144 m bottom Salinity recorded with multiple depths at one site
Total Load North Arm Load RD2 AS2 South Arm Load FB2 LVG4 Salt Load Dynamics, North, South, & Total Lake Load = 3,620 M ton Load = 3,200 M ton kg of TDS North Arm South Arm
Salinity Impact on Evaporation Ra Atmosphere Clouds Air αRs Rl Sensible Heat Latent Heat Rs Water surface Rns Water activity coefficient Hydrogen Bond Water Body Molecule Dissolved salts These molecules have sufficient energy to sever the bonds and enter the air α Ts The rate of re-entering f (concentration)
Penman Equation modified for Salinity Where:- Rn Net Radiation, λv latent heat of vaporization, β water activity coefficient, νa wind speed ∆´ gradient of saturated vapor content of air corrected for salinity, γ psychrometric constant, KE bulk latent-heat transfer coefficient.
The Activity of Water in Brines Using its Chemical Composition From USGS Model... (Parkhurst and Appelo, 1999)
Salinity Impact on GSL Saturation Vapor Pressure Adjusted SVP (kpa) Temperature (C)
Evaluation of Modified Penman Equation 1:1 line modified Penman Un-modified Penman Mass balance Evaporation (m3) LOWESS (R-Defaults) Penman Evaporation (m3)
Per Unit Area Comparison Modified Penman Evaporation (meter)
Possible Reasons for remaining Discrepancies • Errors in P, Q • Errors in ET Climate Data (T, Tdew, Wind Speed) • Errors in Lake Surface Properties (Salinity, Roughness) • Errors in Effective Evaporating AreaErrors in Effective Area for Precipitation • Lake Heat Storage • Freshwater surface lenses
GSL Level Volume Area Conclusions Solar Radiation Precipitation Air Humidity Air Temp. Increases Reduces Mountain Snowpack Evaporation Area Control Supplies Reduces (T,S) Soil Moisture And Groundwater Contributes CL/V Salinity Dominant Streamflow
Summary • Salinity decreases as Lake volume increases. Evaporation increases as salinity decreases. This is a stabilizing feedback. • Across the range of salinity observed the percentages of ionic mass contributed by each ion remain essentially constant. • The saturation vapor pressure over the GSL surface is reduced by (10% - 40%) due to salinity. • The Penman equation modified for salinity is closer to, but underestimates, mass balance evaporation estimates.