Download

1 / 31
310 likes | 471 Vues
Performance Analysis of a Feedback-Controlled Rotary LVAD. Dr: Tohidkhah. Presented By: M. Babakmehr. Introduction. LVAD is a battery-operated, mechanical pump-type device that's surgically implanted. . .

E N D
Performance Analysis of aFeedback-Controlled Rotary LVAD Dr: Tohidkhah Presented By: M. Babakmehr
Introduction • LVAD is a battery-operated, mechanical pump-type device that's surgically implanted . Goal of LVAD: providing the patient with as close to a normal lifestyle as possible until a donor heart becomes available or, in some cases, until the patient’s heart recovers.
What Is The Problem? What Is The Problem? An important challenge facing the increased use of these LVADs is the desire to allow the patient to return home. An appropriate feedback controller for the pump speed Ability to prevent the suction (which may cause collapse of the ventricle.)
Why Controller? • Control Approaches • feedback control approach using the heart rate to control the pump speed. • suction problem • using oxygen saturation of the blood for feedback control purpose • requires implanted transducers • limitations in respond to sudden changes in the patient’s blood demand. • New approach: use of pump flow as a feedback signal for controlling the pump speed • Wide variation of the patient’s SVR: • varying levels of physical activity • emotional changes
LV MODEL • A fifth-order lumped parameter circuit model which can reproduce the left ventricle hemodynamics of the heart. (assumption: RV and pulmonary circulation are healthy)
LV MODEL Afterload Mitral Valve Aortic Valve Preload & Pulmonary Circulations • Compliance C(t) is the reciprocal of the ventricle’s elastance E(t). • The elastance describes the relationship between the ventricle’s pressure and volume: Aortic Compliance
Elastance Function Of The LV “double hill” function: E(t) = 1/C(t) & Cardiac Cycle=60/HR)
Three! Different Modes Of Operation Of The LV • every mode operation within the cardiac cycle is modeled by a different circuit, and hence a different set of DEs. • appropriately modeling : by appropriately modeling the diodes as nonlinear elements, it is possible to write only one set of differential equations, which describes the behavior of the entire model for all three modes. write only one setof DEs.
The solution is oscillatory in nature due to the cyclic nature of the terms C’(t)/ C(t) and 1/C(t)
MODEL VALIDATION #1 • Diastolic Pressure • SystolicPressure Gyton’s textbook Simulation waveforms of the hemodynamics for an adult with heart rate of 75 bpm
MODEL VALIDATION #2 Changingafterload Conditions By Selecting Different SVRs While KeepingEDV Constant ChangingPreload Conditions By Changing The Mitral Valve Resistance RM • Is it a linear relationship between End-Systolic Pressure and LV Volume? (i.e. linear ESPVR) • vary the preload and afterload conditions, while keeping the left ventricle parameters (Emax, Emin, V0) constant.
MODEL VALIDATION #3 • comparing the hemodynamic waveforms obtained from the model to those of a human patient. SW model = 10492 mmHg.ml SWMeasured=10690 mmHg.ml Error=4.4%
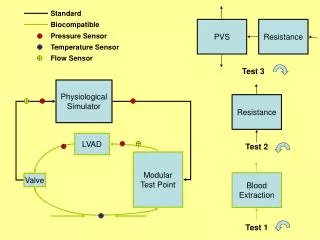
CARDIOVASCULAR-LVAD MODEL Pressure difference across the pump: x6(t): blood flow through the pump Ri & Ro: inlet and outlet resistances of pump cannulae. Li & Lo: inlet and outlet inertances of pump cannulae Rk: NLTV-pressure-dependent resistor (suction) threshold pressure
Cardiovascular And LVAD Model (Forced System) Control Variable: ?
Development Of Feedback Controller • Speed of rotation : The only available mechanism to control a rotary LVAD is to increase or decrease the speed of rotation of the pump in order to meet certain goals typically related to the well being of the patient A major challenge for over 15 years: • Providing required cardiac output • Suction does not occur
Our method in control: • A full state feedback Controller may be developed if the hemodynamic variables can be continuously measured in real-time. However, current implantable sensor technology to achieve this goal does not exist. The pump flow state variable , on the other hand, is the only state variable that can be measured in real time In this study the pump speed is increased linearly until suction is reached while observing the pump flow signal. This data shows that the onset of suction is characterized by several phenomena which include: • 1- sudden large drop in the slope of the envelope of the minimum pump flow signal • 2- Sudden change in the signature of the pump flow signal
Pump Flow signal measured in an animal in-vivo Study using WorldHeart LVAD
Envelope Of The Minimum Pump Flow Signal changing from a positive value to a large negative value
Examining The Behavior Of x6(t) In Our Model similar characteristics as the in-vivo animal data
Controller functions: • The controller consists of three basic functions . The first, labeled “Extract Minimum” will track the minimum value of the pump flow signal within each cardiac cycle. • The second, labeled “Calculate Slope,” will estimate the slope of the envelope of minimum values. • The third function, labeled “Speed Update” provides a mechanism for adjusting the pump speed based on the calculated slope until the maximum of the minimum pump flow signal is reached .
Simulation Results • To be able to assess the performance of our controller we need to determine the suction speed as a function of RS • RS= level of activity of the patient RS level of activity RS level of activity
Performance Analysis: Simulation #1 RS=cte • able to increase and maintain the pump speed to a level below the suction speed
Performance Analysis: Simulation #2 RS=Var • able to increase and maintain the pump speed to a level below the suction speed
Performance Analysis: Simulation #3RS=cte , SNR = 29.40 (dB) • able to increase and maintain the pump speed to a level below the suction speed
Performance Analysis: Simulation #3RS=var , SNR = 5.48 (dB) • the pump speed was getting in and out of suction frequently (while the controller performed very well by keeping the pump speed below the suction speed for a high SNR)
Refrences • A Dynamical State Space Representation and Performance Analysis of a Feedback-Controlled Rotary Left Ventricular Assist Device IEEE TRANSACTIONS ON CONTROL SYSTEMS TECHNOLOGY.(2009) • Performance Prediction of a Percutaneous Ventricular Assist System Using Nonlinear Circuit Analysis Techniques IEEE TRANSACTIONS ON BIOMEDICAL ENGINEERING, FEBRUARY 2008 • Modeling, analysis, and validation of a pneumatically driven left ventricle for use in mock circulatory systems Medical Engineering & Physics 29 (2007) 829–839
Thank You For Your Attention • Any Questions? • Contact information: mbmce.2008@gmail.com