Download
1 / 40
410 likes | 438 Vues
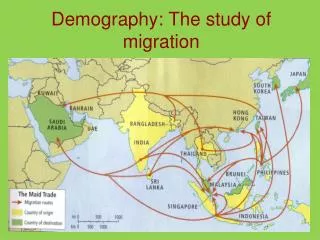
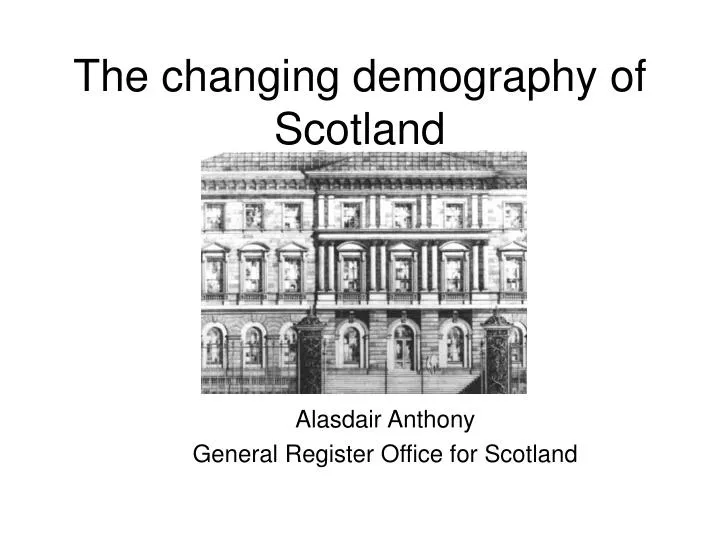
The changing demography of Scotland. Alasdair Anthony General Register Office for Scotland. Scotland’s population, 1855 to 2008. Births and deaths in Scotland, 1951 to 2008. Changes to the population. Changes to the population. Ageing. Changes to the population. Ageing. Migration.

E N D
The changing demography of Scotland Alasdair Anthony General Register Office for Scotland
Changes to the population Ageing
Changes to the population Ageing Migration
Migration statistics on GROS website: www.gro-scotland.gov.uk/statistics/migration/index.html Comments and suggestions to Alasdair Anthony: alasdair.anthony@gro-scotland.gsi.gov.uk 0131 314 4699 Population and Migration Statistics General Register Office for Scotland
Allan Findlay (Centre for Applied Population Research, University of Dundee) Community impacts of demographic change
Allan Findlay (Centre for Applied Population Research, University of Dundee) The changing demography of Scotland – a selection of impacts at community level • Selective community impact of immigration (a) EU arrivals discussed by Alasdair (b) Segregation of ethnic minorities 2) Changing household composition (issues associated with single person households and HMOs) Research resources relating to the impacts of demographic change and the community Centre for Population Change (funded by ESRC) Scottish Longitudinal Survey (funded by Scottish Government, SFC, CSO, GROS and ESRC
Is a community segregated by ethnicity or faith?
Migration Controversies Claim: Immigration has resulted in segregation and the growth of parallel communities Trevor Phillips chair of the Commission for Racial Equality said ‘Britain is sleepwalking towards segregation’ (2005) Research Evidence: Patterns of settlement by race or ethnicity are far from random or even Residential segregation tends to reflect particular histories of immigration (eg pattern of Pakistanis, Indians and Bangladeshis) Studies of 1991 and 2001 censuses refute claims of increased segregation – lower than in USA and much lower for some than in the past (Simpson, 2004) It can be argued that segregation reflects poverty, wealth and opportunity and not racial conflict Overall the evidence shows that as groups get wealthier, segregation declines and people move out of the city centres The most segregated groups are Jews and Sikhs, not Muslims. In Scotland Catholics are more segregated than any minority religious or ethnic group
De-segregation of Indians and Pakistanis in Glasgow and Dundee, 1981-2001 (from Munoz, 2006, Centre for Applied Populaion Research,PhD student, Univ of Dundee) • Segregation of both groups declines over time • Segregation levels were higher for Pakistanis, but still declined overall • Reduction in segregation was greater for both groups in Dundee than Glasgow.
Change in household numbers and composition, 1981-2006Source:GROS: Estimates of Households and Dwellings,Scotland 2008
Changing Household Composition (source- General Registrar Office, Scotland)
One person households by deprivation, 2008(Source GROS Annual Review)
Top 10 locations in Scotland for multiple occupancy households (not including pensioners)
Media and policy concerns about Household of Multiple Occupancy • Eg National HMO Lobby • ‘The Lobby therefore opposes concentrations of HMOs in general (as a unique threat to the sustainability of communities) and studentification in particular (as the principal cause and effect of HMO concentrations).’ • Eg. the All Party Parliamentary Group for Balanced and Sustainable Communities • ‘Whilst the group welcomes the contribution students make to towns and cities in the UK, it is concerned about the impact of an imbalance between student and local residents’ housing. The group therefore supports: changes in planning law to possibly control the amount of student housing in particular streets and thus ensure that our communities are balanced; a requirement to license all private rented accommodation, including student housing; adequate provision for family housing in all communities.’
What is the HMO problem?(source: D.Smith, 2009) • Higher levels of population transience (‘churn’) • Less attachment and sense of belonging • Breakdown of community cohesion • Lower levels of social capital / electoral voting • Fragmentation of sense of community • Increased density of population • Associated environmental challenges (e.g. refuse, litter, flytipping, car parking, noise) • Lack of affordable housing • Dilapidation of housing stock • Claimed higher levels of crime • Rise of uni-dimensional / mono population structures • Loss of social mixing • Increased resources required for day-to-day management (economic recession!) • Claimed to be the contradiction of balanced and sustainable communities
Percentage of dwellings with council tax ‘occupied exemptions’ (eg student households)Source: GROS, 2009
New data sets and new research 10+ new research projects starting across Scotland in 2009 (eg at Univ of Dundee on gangmasters and EU migrants)
Conclusions Demographic change at community level shows many changes that run contrary to public opinion (eg we are not ‘sleepwalking towards segregation) Demographic datasets help reveal patterns at community level that may differ from those popularly perceived (eg the difference between the pattern of self-identifying faith groups and those of perceived visible ethnic groups) Household change at local level points to significant community changes due to more single person households and to concentrations in particular locations of new household types (eg HMOs that ‘long-term residents’ may find threatening). Powerful new datasets now allow longitudinal analysis of key demographic groups and communities