Download
1 / 2
30 likes | 132 Vues
WIRELESS SENSOR NETWORKS TO MONITOR SEDIMENT DYNAMICS Dr JE Tateson, Dr C Roadknight, Prof IW Marshall at BT Exact, with UEA, Essex University, UCL, Plextex and Intelisys. A wind farm in Denmark, similar to the one that will be on Scroby Sands.

E N D
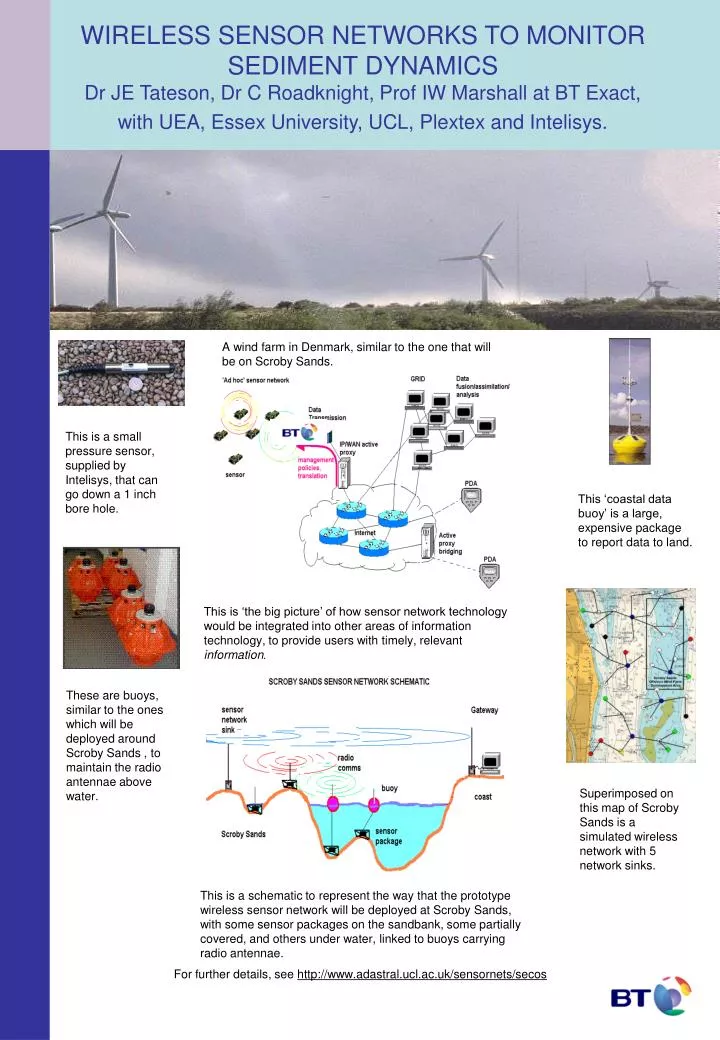
WIRELESS SENSOR NETWORKS TO MONITOR SEDIMENT DYNAMICS Dr JE Tateson, Dr C Roadknight, Prof IW Marshall at BT Exact, with UEA, Essex University, UCL, Plextex and Intelisys. A wind farm in Denmark, similar to the one that will be on Scroby Sands. This is a small pressure sensor, supplied by Intelisys, that can go down a 1 inch bore hole. This ‘coastal data buoy’ is a large, expensive package to report data to land. This is ‘the big picture’ of how sensor network technology would be integrated into other areas of information technology, to provide users with timely, relevant information. These are buoys, similar to the ones which will be deployed around Scroby Sands , to maintain the radio antennae above water. Superimposed on this map of Scroby Sands is a simulated wireless network with 5 network sinks. This is a schematic to represent the way that the prototype wireless sensor network will be deployed at Scroby Sands, with some sensor packages on the sandbank, some partially covered, and others under water, linked to buoys carrying radio antennae. For further details, see http://www.adastral.ucl.ac.uk/sensornets/secos
GLACIER DYNAMICS AND CLIMATE CHANGE AT BRIKSDALSBREEN Dr Jane K. Hart, Dr Kirk Martinez, Prof. Harvey Rutt,Dr Royan Ong, Dr Joe Stefanov, Daniel Miles, Sue WayDepartments of Geography and Electronics and Computer Science, University of Southampton; Prof. I. Marshall & David Robinson BT, Nathan Boyd & John Argirakis Intellisys, UK; Dr A. Ford, University of Utah. Hot water drill – this is used to melt a hole in the ice to insert the subglacial probes. Ground Penetrating Radar – this can be used to map out the depth of the glacier. web Snow depth meter Base station Sediment Ice Subglacial probe – 12cm long, this will be put within and beneath the glacier to measure location, tilt, orientation and pressure. The aim of this project is to study glacier response to climate change. Jostedalsbreen is one of the few locations in the world where glaciers are currently advancing, because global warming has led to increased precipitation. Briksdalsbreen has advanced 600 m since 1955 with 390m of advance between 1987 and 1996, during which time the glacier advanced over its proglacial lake into a birch forest. Although since 1996 the glacier has been slowly retreating, other nearby glaciers are still advancing (e.g. Bødalsbreen, Nigardsbreen and Bergsetbreen). Glaciers are controlled by the amount of snow gained each year, the amount of melting, the local topography and the geology of the bed. When glaciers move over weak rocks, they are able to flow faster. This glacier is flowing over glacial lake materials which means there is probably a weak water-saturated layer of glacial sediments (till) beneath the till contributing to glacier motion. This project aims to use the most advanced technological methods to monitor and understand glacier dynamics. This is the first time such a scheme has been attempted, and many of the techniques are being tested for the first time. The project will run during 2003-5 and link together the following: • Understanding subglacial behaviour by insertion of ‘Subglacial Probes’ beneath the glacier by holes drilled in the ice by a hot water drill • Measuring ice thickness and bed rock geology with radar (Ground Penetrating Radar) • Measuring glacier movement by satellite radar (inSAR) and differential GPS • Developing an automated snow measuring instrument • Collecting and linking the data via a wireless sensor web (GLACSWEB) and sending the data back to UK where it is displayed on the internet. Communications – the probes send their data back to the surface, and then to the reference station by radio communications. Live data is then sent to the internet. Satellite image of Jostedalsbreen – this will be used with radar data to calculate glacier velocity over the ice cap. Sedimentology – data from the proglacial area of the flutes (right) and push moraines (below) show that there is probably a wet sediment layer beneath the glacier. Reference station Live data can be seen at: http://www.ecs.soton.ac.uk/~km/projs/probe