Download
1 / 50
500 likes | 622 Vues
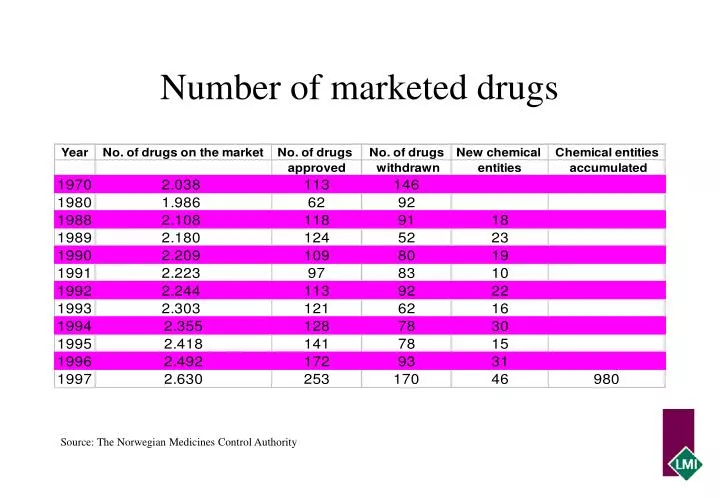
Number of marketed drugs. Source: The Norwegian Medicines Control Authority. Number of marketed drugs manufactured in Norway and abroad. The top 20 pharmaceutical companies on the Norwegian market, 1998 Sales, veterinary products excluded. The top 25 drugs in Norway, by value, 1998.

E N D
Number of marketed drugs Source: The Norwegian Medicines Control Authority
The top 20 pharmaceutical companies on the Norwegian market, 1998 Sales, veterinary products excluded
The top 25 drugs in Norway, by value, 1998 The top 25 drugs represent 2,175 mill NOK, corresponding to approximately 35% of the total sales on pharmacy purchase level Source: FARMASTAT
The top 10 drugs in Norway, by units, 1998. Number of units sold (x 1000 Product Several products on this list are painkillers. Albyl-E is in addition to being a painkiller also used as an anticoagulant in low doses.Otrivin, Rhinox and zymelin are nasal decongestants, in cold. Source: FARMASTAT
Sales of drugs distributed on therapeutic groups (ATC), 1996 and 1997
Number of units of drugs sold distributed on non-prescription and prescription drugs, 1998 65.5 million units of drugs were sold in 1998. 55% of these were prescription drugs and 45% were non-prescription drugs. 47% of all prescriptions handled in the pharmacies are reimbursable prescriptions (blue-prescriptions). There are in average more units prescribed per blue prescription in comparison with white prescriptions (non-reimbursable) - 55% of all units of prescription drugs sold are reimbursable. Kilde/Source: Norges Apotekerforening, FARMASTAT, The Norwegian Association of Proprietor Pharmacists, FARMASTAT
Prescription drugs - percentage reimbursable, 1997 65.5 million units of drugs were sold in 1998. 55% of these were prescription drugs and 45% were non-prescription drugs. 47% of all prescriptions handled in the pharmacies are reimbursable prescriptions (blue-prescriptions). There are in average more units prescribed per blue prescription in comparison with white prescriptions (non-reimbursable) - 55% of all units of prescription drugs sold are reimbursable. Source: The Norwegian Association of Proprietor Pharmacists, FARMASTAT
Prescription drugs - percentage reimbursable, 1997 65.5 million units of drugs were sold in 1998. 55% of these were prescription drugs and 45% were non-prescription drugs. 47% of all prescriptions handled in the pharmacies are reimbursable prescriptions (blue-prescriptions). There are in average more units prescribed per blue prescription in comparison with white prescriptions (non-reimbursable) - 55% of all units of prescription drugs sold are reimbursable. Source: The Norwegian Association of Proprietor Pharmacists, FARMASTAT
Private pharmacies’ composition of sales, 1997 Source: The Norwegian Association of Proprietor Pharmacists
Sales of drugs in Norway, fixed and variable prices, 1980 - 1998 Source: Norwegian Board of Health and Statistics Norway
Distribution of the total drug sales. (Pharmacy retail level) 31.1% of the total drug bill is covered by the consumers. The patients’ contribution is distributed on non-reimbursable drugs, non-prescription drugs, veterinary products and co-payment for reimbursable drugs. The diagram is made by using data from various sources and should only be used with that in mind Source: LMI
Public health care and drug expenditure, 1988 - 1997 1)National Insurance and hospitals 2) % of public health care expenditure Source: Statistics Norway and The Norwegian Board of Health
National Insurance Administration drug expenditure, percent increase, 1989 - 1998 Source:National Insurance Administration
Drug expenditure in private and public sector, 1989 - 1997Sales on pharmacy retail level Source: The Norwegian Board of Health
Drug expenditure in private and public sector, 1989 - 1997Sales on pharmacy retail level Source: The Norwegian Board of Health
Public drug expenditure* (1997-currency) * National insurance and hospitals The figures are in 1997-currency (corrected by the consumer price index) VAT in Norway was 20% until 31.12.1992. It was increased to 22% on 01.01.1993 and to 23% on 01.01.1995. Source: The Norwegian Board of Health
Public drug expenditure, percent increase, excl. VAT, (1997-currency) Public drug expenditure: National Insurance and hospital. The increase in expenditure is calculated in 1997-currency(corrected by the consumer price index) Source: The Norwegian Board of Health
The share of innovative drugs of the total sales, 1993 - 1998Sales in mill NOK, 1998-currency, on pharmacy purchase level Source: LMI
Public health care expenditures, NOK per capita, 1997 Source: Statistics Norway
Consumer expenditure on pharmaceuticals compared to other expenses NOK per capita, 1997 Source: Statistics Norway and Norwegian Board of Health
Norway’s import and export of pharmaceutical products, 1988 - 1997 Source: Statistics Norway, based on OECD Standard International Trade Classification (SITC) division 54
Import distributed on countries of origin, 1997 Total import 1997: 4.363 mill NOK Source:Statistics Norway, based on OECD Standard International Trade Classification (SITC) division 54
Export distributed on export countries, 1997 Total export 1997: 1.537 mill NOK Source:Statistics Norway, based on OECD Standard International Trade Classification (SITC) division 54
The Pharmaceutical Industry’s investments in research and development (R & D) in Norway, NOK million, 1995 - 1997 Source: LMI
The Pharmaceutical Industry’s investments in research and development (R & D) in percent of drug sales in Norway (pharmacy purchase price), 1995 - 1997 Source: LMI
Parallel imported drug sales in Norway, 1995 - 1998 (pharmacy purchase price in NOK million) Percentage of drug sales 0,2 1,4 3,4 6,9 Source: FARMASTAT
Structural effects in sales, (pharmacy purchase price), 1989-1998 Total sales increased by 10.3% in 1998 (pharmacy purchase price). The increase is caused by a price reduction of -0.9%, an increase in number of doses (change in quantity) of 5.9% and change due to new drugs of 5.3%. Source: Norwegian Medicinal Depot
Prices on drugs - divided on the distributors, 1996 Prescription and non-prescription drugs. Source: Norwegian Competition Authority
Price changes on drugs (pharmacy purchase price) and general inflation, annual percent increase, 1993-1998 Source: Statistics Norway, Norwegian Medicinal Depot
Leading Corporate Groups, Global Performance, 1996 Source: IMS International, Pharmaceutical World Review (Presented by MEFA in Facts, 1997)
Leading products world-wide, 1996 Source: Scrip Magazine, 1998 (Presented by LIF in Facts, 1998)
Price level on drugs in some European countries, 1998Norway = 100 The price index is calculated from pharmacy purchase prices and Swedish volumes in 1997, and exchange rates per 2.1.98. The pharmacy purchase prices are from each country’s pharmacy price lists. Source.: Apoteket AB, Sweden. (The figures are calculated to Norway = 100)
Pharmaceutical consumption per capita in Europe, 1997 The figures are calculated on the basis of sources, using methods specific to each country. Strict comparisons between countries may therefore not be reliable. Source: EFPIA
Health expenditure in OECD-countries, 1996Totale helseutgifter i % av BNP / Total health expenditure in % of GDP 1994 -figures: Turkey GDP: Gross Domestic Product The figure for Norway in the above diagram is different from the ones presented on page 15 due to different data sources. Source: OECD in figures, 1998
Public drug expenditure in percent of public healthcare expenses in some European countries, 1997 Source: EFPIA
Composition of consumer prices (%) of medicine in Europe (pharmacy retail price), 1996 Source: EFPIA (presented by LIF in Facts, 1998)
Composition of consumer prices (%) of medicine in Europe (pharmacy retail price), 1996 Page 2 1. The ”official” wholesaler’s margin is 12,5%, but of this 7,5 % is passed on to the Pharmacists as incentive bonus. VAT; Zero on prescrption medicines and 17,5 % on OTC. 2. VAT on OTC are 25 % and no VAT on prescription drugs. 3. VAT on OTC are 5 % 4. Prescription only medicine. 5. Prices are on oral medicine only 6. 1997- figures 7. Reimburable medicine. 8. Local manufactures only. Other taxes (13,0 %), besides VAT (7,4 %) 9. VAT and Pharmacy fee.
VAT on drugs and other products and services in Europe, 1999 VAT RATES APPLIED TO MEDICINES PER FEBRUARY 1, 1999 1)FRANCE: Reimbursable medicines 2.1%. Non-reimbursable medicines 5.5% 2) IRELAND: Oral medication 0%, other medication 21% 3)AUSTRIA: 0% for medicines covered by health insurance Source: EFPIA
The most common causes of death, 1995 Source: Statistics Norway
Disablement pensions according to diagnosis, 1997 Total number of disablement pensions per December 1997: 246 541 Source: National Insurance Administration
Expenditures of the National Insurance (NOK billion), 1998 Source: National Insurance Administration
Expenditures of the National Insurance National Insurance Administration’s expenditures in 1998: NOK 150 355 millions Source: National Insurance Administration
Operating costs at the largest hospital in Norway, (Ullevål hospital) in 1996 and 1997 (percent share) Source: Ullevål Hospital
Prescription statistics, 1997. Reimbursable drugs, distribution of sales on reimbursement groups Calculated on the basis of sales from a selection of pharmacies Source:The Norwegian Association of Proprietor Pharmacists
Key figures for hospital admissions Source: Statistics Norway
Inhabitants per physician and per dentist, 1994 - 1998 Source: The Norwegian Board of Helth and Statistics Norway
Inhabitants per pharmacy, 1994 - 1998 Source: The Norwegian Board of Health and Statistics Norway