1 / 0

Benefits of Energy Management

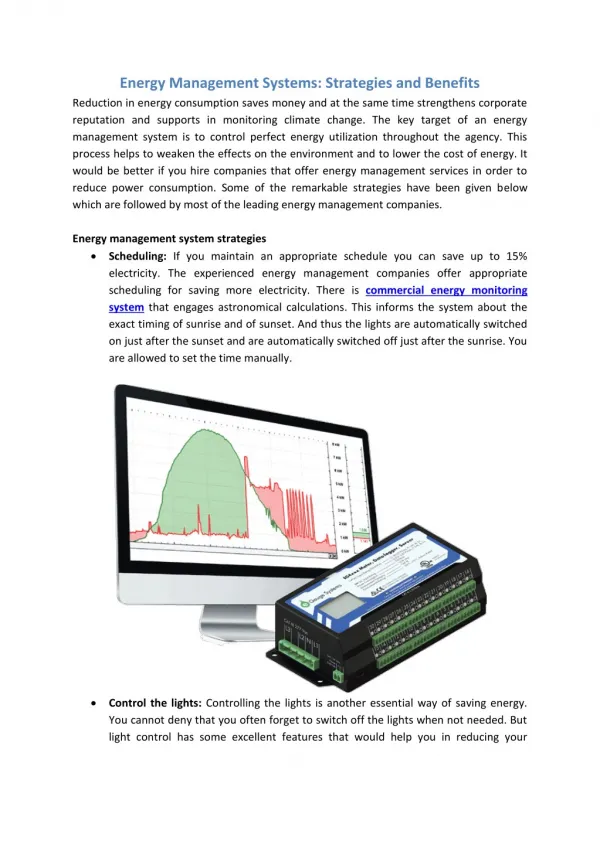
Benefits of Energy Management. Presented by Mark Leinmiller. Smart Water for Smart Cities Workshop 1:00 PM Tuesday May 20, 2014. By end of this session you will know…. What Energy Management is How Energy Costs impact operations First steps in Energy Management

sevita
Télécharger la présentation

Benefits of Energy Management

An Image/Link below is provided (as is) to download presentation Download Policy: Content on the Website is provided to you AS IS for your information and personal use and may not be sold / licensed / shared on other websites without getting consent from its author. Content is provided to you AS IS for your information and personal use only. Download presentation by click this link. While downloading, if for some reason you are not able to download a presentation, the publisher may have deleted the file from their server. During download, if you can't get a presentation, the file might be deleted by the publisher.

E N D

Presentation Transcript


  1. Benefits of Energy Management

    Presented by Mark Leinmiller Smart Water for Smart Cities Workshop 1:00 PM Tuesday May 20, 2014
  2. By end of this session you will know… What Energy Management is How Energy Costs impact operations First steps in Energy Management Alternative funding for Energy projects Measurable benefits of Energy Management
  3. What is Energy Management? Ideally, it is a comprehensive, ongoing program involving all levels of W/WW system employees targeted at controlling costs associated with energy and maximizing system reliability. Schneider Electric – Session Title – Smart Cities for Smart Water: A Workshop
  4. Why is Energy Management Important? Typical City Energy Usage Paying the bills One of largest monthly bills What % of your city/county energy spend goes to W/WW ? Dallas, TX @ 50% Houston, TX @ 50% Clinton, AR @ 65-70% Tulsa, OK @ 60% Performance Indicator Car: MPG What if dropped 20% Specific Energy (KWH/MG)? RWI pump dropped 20% Train 1 vs. Train 2 15% more efficient. Why? Schneider Electric – Session Title – Smart Cities for Smart Water: A Workshop
  5. We can’t wait for new technologies we don’t have to Efficiency solutions are available now
  6. Plant Profile Wastewater Treatment Plant 70 MGD avg flow 90 MGD design Influent BOD5: 142 Effluent BOD5: 2.4 No trickling filters Nutrient removal Average Annual Electrical Spend 8.9 cents/KWH 1,800 KWH/MG $3,979,413 Potential Annual Savings $1.2M @ 30% See your potential savings: http://www.se-eml.com Schneider Electric – Session Title – Smart Cities for Smart Water: A Workshop
  7. What is my strategy?Energy & Sustainability Consulting – Get some help Strategic Energy Planning Sustainability Roadmaps Energy Star/LEED Assessments Energy Market Intelligence Energy Rebates & Incentive Support Doing nothing is a also a strategy Have to decide how valuable How fits with local culture
  8. How do I buy?Energy Procurement Services Energy Sourcing Renewable Asset Management Rate & Tariff Analysis Demand Response Energy Risk Management
  9. How do I control?Power Reliability & Metering Metering Design & Commissioning Third-party Systems Integration Remote Energy Monitoring Emergency Power Supply Systems Power System Control Demand Control
  10. How do I optimize?Infrastructure & Efficiency Upgrades Process Optimization Systems Automation & Integration Design/Build Energy Projects Performance Contracting Mechanical & HVAC Retrofits Renewable Energy Solutions
  11. How am I performing?Measurement & Reporting Performance Assurance Energy & Carbon Reporting Operations & Maintenance Support Sequence of Events Recording Energy Data Analysis Cannot manage what you do not measure
  12. First Steps in Energy Management
  13. How do I get started? Figure out where you are today Get a baseline Compare monthly power bills to flows May have seasonal variations Look at penalties Demand charges Power factor charges Other power quality issues Ask for help from trusted advisors Consultants Vendors Put together a long-range plan to get a handle on energy spend and how to reduce it. And keep it down! Energy prices are only going to go up! Schneider Electric – Session Title – Smart Cities for Smart Water: A Workshop
  14. How do I monitor? Start with what you already have 3 Main Elements Monitoring Devices record data Power meters Motor protection relays Circuit breakers with comms UPS systems Generator systems Software to accumulate & manage data, display information Existing SCADA Purpose-built software Communications interface SCADA network, RTUs Schneider Electric – Session Title – Smart Cities for Smart Water: A Workshop
  15. Build system out further Create some basic screens for trending Trend usage data Send data to historian Correlate energy data with operational data Generate benchmarking reports As you start seeing the benefits, grow the system More metering means better data Specific processes Individual pieces of equipment Predictive maintenance More reliability Schneider Electric – Session Title – Smart Cities for Smart Water: A Workshop
  16. Adding Power Quality to system Energy monitoring How much energy consumed Basic data (kWH) Can be broken down by process Even down to the individual equipment or motor level Can be done with existing SCADA Can use many existing devices from numerous manufacturers Tie energy consumed to flows (kWH/MG) Compare your plant to benchmarks (Energy Star) Power monitoring Includes energy monitoring Adds Power Quality aspects Sag, surge, spike, transient Waveform capture, analysis Advanced features improve predictive maintenance, diagnostics, mean-time-to-repair, Alarming Direction detection Sequence-of-events recording (SER) Harmonics, resonance Specialized PQ devices required Schneider Electric – Session Title – Smart Cities for Smart Water: A Workshop
  17. Power Monitoring Benefits to Operations RELIABILITY Capture disturbances before equipment failure Recoup costs from power company for damages Determine, Monitor and Reduce Energy Consumption Reduce Energy Costs Manage Electric Demand Central Command Center Computers & Process equipment should ride throughevents inside the “envelope” Events outside the envelope are severe enough to cause misoperation Schneider Electric – Session Title – Smart Cities for Smart Water: A Workshop
  18. Power Monitoring Benefits to Engineering Capacity planning Easy access to data On-line documentation Increase reliability Minimize downtime Benefits to Maintenance Alarming / Paging Automatic Meter Readings Generator Testing Identify Leaks / Waste Increased safety Easy access to data On-line documentation Increase reliability Minimize downtime Schneider Electric – Session Title – Smart Cities for Smart Water: A Workshop
  19. Environmental & Safety - Time and Money Arc Flash Events Optional remote breaker operation Enhanced Safety Minimize Protective Equipment issues
  20. Which method is safer?
  21. Minimize Personnel Exposure Avoid the hazard of installing temporary portable monitors Avoid safety hazards to personnel connecting to energized equipment Environmental & Safety - Save Time and Money
  22. Typical 2 – 5% reduction Reduce Utility Cost Typical 2 – 5% reduction Optimize Equipment Additional 2 – 5% reduction Improve Reliability Spot energy waste or inefficient users Improve efficiency with accurate & timely data. (kWh/gallon, per shift) Drive ‘accountability’ by allocating costs Double check the utility bill ! Identify “true” elec. gear capacity Maximize equipment life (maybe defer capital expense) Real Time Alarms can notify of approaching breaker trip, or overheating motor, single phase alarm Diagnose power problems to avoid them next time
  23. 3 Part Energy Reduction Approach Energy Efficiency Demand Response Renewables Utility Demand Before Utility Demand Before Utility Demand Before Utility Demand After Utility Demand After Utility Demand After Lowers energy demand by reducing ongoing energy use Lowers utility energy demand by shedding loads during peak period only, may preserve grid integrity and/or provide an economic incentive Derives some part of energy need from regenerative or non-depleting resources, thereby lowering total utility energy demand
  24. Potential Funding Mechanism
  25. Annual cost of doing nothing Save or buy? You can use the savings to: finance energy efficiency projects finance infrastructure upgrades
  26. Current Utility Budget After performance contracting, the budget remains the same as energy savings pay for the facility improvements. Performance Contracting Here’s How It Works Example of Your Annual Energy Budget:
  27. What Can We Get Through a Comprehensive Energy Efficiency Project? Quick Payback Long Payback Cost Cost Savings Savings Aeration System Optimization Biogas for CHP Optimize Digester Performance Real-time Energy Monitoring SCADA System VFDs
  28. Project Management Performance Contracting Approach: One Company Accountability General contractor Construction manager at risk Subcontractor management Bid-Spec Approach with Traditional Construction: Multiple Accountabililty Sources Client hires general contractor as project manager Risky, expensive and time Management of subcontractors EnergyManagement
  29. Engineered Solution Performance Contracting Approach: Focus on Energy Efficient Operations and Design Maintenance of normal operating parameters Emphasis on long-term system performance and cost factors Holistic design that capitalizes on the interactions of the ECMs Bid-Spec Approach with Traditional Construction: Focus on Exceeding Operating Paramenters Energy efficiency can compete with operating parameters Emphasis not on long-term system performance Piecemealing ECMs doesn’t create synergy EnergyManagement
  30. Savings: Energy, Chemicals, Labor, Fines Performance Contracting Approach: Guaranteed Energy Savings Fund Improvements Savings are maximizedover time when improvements are done at once Project designed for performance Measurement and verification of savings EnergyManagement Bid-Spec Approach with Traditional Construction: Sporatic Savings Can Occur; Not Guaranteed Savings degradation over time if performance not made visible Focus is meeting specifications, not achieving savings
  31. Financial Guarantee Performance Contracting Approach: Partner for Performance Guarantee ensures a partner Vested interest in project performance Accountable for results EnergyManagement Bid-Spec Approach with Traditional Construction: Bid-Spec; On to Next Project Not responsible for savings being achieved or guaranteed No vested interest over the long-term
  32. Financing & Funding Sources Schneider Electric’s PC Approach: Provide Options and Support Municipal-lease financing, bonds, or cash Schneider Electric can help procure financing packages Maximum rebates, incentives, and additional funding mechanisms EnergyManagement Bid-Spec Approach with Traditional Construction: As Capital Funds are Available Financing clients’ responsibility Client has responsibility of researching/applying for additional funding/grants
  33. City of Denison Case Study Denison, TX Project Cost $7,943,747 Guaranteed AnnualSavings $217,727 Project Scope Improvements to their Aeration Basin & Aerobic Digester including new fine bubble diffusion grids Replacement of 750 hp of blowers and 400 hp of pumps Replacement of 3 old switchgear/MCC’s with Sq D switchgear Lighting, EMS, HVAC Project Enablers City Manager (CFO) was a proponent; had previous experience elsewhere with PC Proposed improvements were already known issues Budget $ already set aside for some improvements
  34. Example Water ESPC Project Current Energy Budget - $694,378 Water Plant – 10MGD – Surface Water Annual Energy Use and O&M Costs = $694,378 ECMs – Rebuild 3 – 450HP turbine pumps New high efficiency motors and drives on finished water Upgrade of SCADA system Upgrade of filter valve actuators Upgrade of chemical feed ECM Costs = $2,423,918 Rebates/Grants/Incentives = $270,000 Guaranteed Annual Savings = $150,305 – 15 Yr Contract After PC
  35. Measurable Benefits
  36. Measurable Benefits of Energy Management Schneider Electric – Session Title – Smart Cities for Smart Water: A Workshop
  37. Measurable Benefits of Energy Management Schneider Electric – Session Title – Smart Cities for Smart Water: A Workshop
  38. Measurable Benefits of Energy Management Schneider Electric – Session Title – Smart Cities for Smart Water: A Workshop
  39. Measurable Benefits of Energy Management Schneider Electric – Session Title – Smart Cities for Smart Water: A Workshop
  40. Measurable Benefits of Energy Management Schneider Electric – Session Title – Smart Cities for Smart Water: A Workshop
  41. Who Cares?
  42. What is the Best Investment of $100,000 in the last 10 years? Amounts shown exclude return of initial investment
  43. Summary We have seen that Energy Management is an effective tool for: Improving electrical system reliability Reducing the possibility for “stuff in the streets” or boil water advisories Identifying and Reducing energy consumption Lowering energy costs Lowering maintenance costs Verifying utility bills Getting reimbursed for supply-side damages Improving safety, reducing exposure to arc flash Meeting EPA’s desire for energy benchmarking in W/WW facilities What is that worth to your organization? Schneider Electric – Session Title – Smart Cities for Smart Water: A Workshop
  44. Conclusion Energy Management is an ongoing process, not a one-time event W/WW Energy is one of the biggest expenses of all municipalities Getting started isn’t as hard as you might have thought Zero capital Investment options are available There are very many financial aspects to Energy Management
  45. Questions? Mark Leinmiller Segment Manager Water Wastewater Competency Center 225 TownparkDrive, Suite 400 Kennesaw, GA 30144 Office: 770.792.4842 | Mobile: 770.329.3878 Mark.Leinmiller@Schneider-Electric.com www.schnedier-electric-water.com
  46. Make the most of your energy™ http://www.schneider-electric-water.com
More Related