Download
1 / 1
10 likes | 119 Vues
Sensors. Output. Vertical distributions of oxygen, turbidity, fluorescence (left plot), acoustic echo (middle plot), and zonal current velocity (right plot) The mean gradient Richardson number estimates

E N D
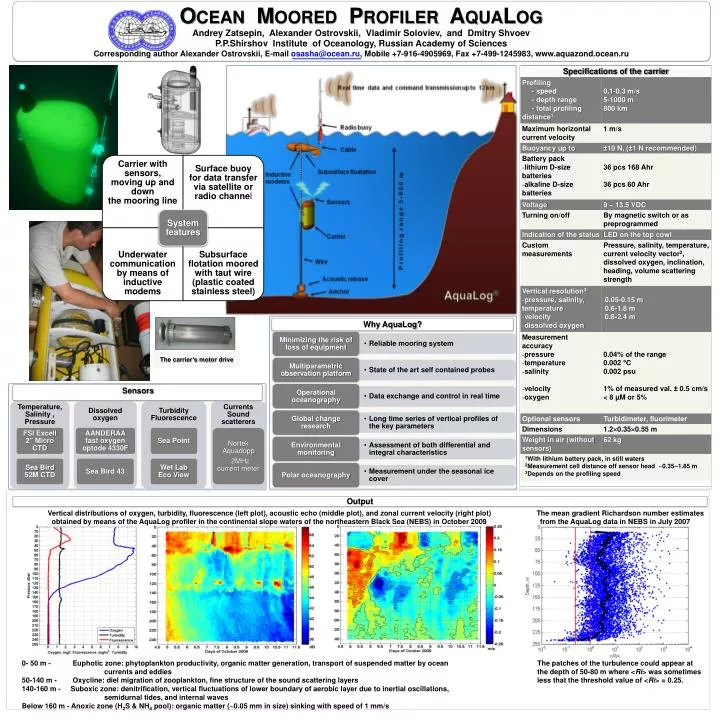
Sensors Output Vertical distributions of oxygen, turbidity, fluorescence (left plot), acoustic echo (middle plot), and zonal current velocity (right plot) The mean gradient Richardson number estimates obtained by means of the AquaLog profiler in the continental slope waters of the northeastern Black Sea (NEBS) in October 2009 from the AquaLog data in NEBS in July 2007 0- 50 m - Euphotic zone: phytoplankton productivity, organic matter generation, transport of suspended matter by ocean The patches of the turbulence could appear at currents and eddies the depth of 50-80 m where <Ri> was sometimes 50-140 m - Oxycline: diel migration of zooplankton, fine structure of the sound scattering layers less that the threshold value of <Ri> = 0.25. 140-160 m - Suboxic zone: denitrification, vertical fluctuations of lower boundary of aerobic layer due to inertial oscillations, semidurnal tides, and internal waves Below 160 m - Anoxic zone (H2S & NH4 pool): organic matter (~0.05 mm in size) sinking with speed of 1 mm/s