Download
1 / 10
100 likes | 203 Vues
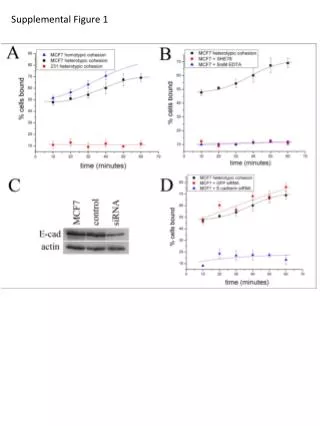
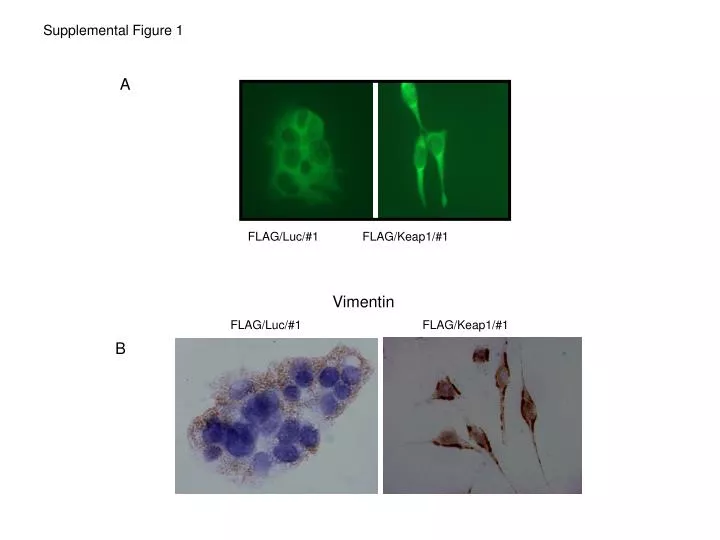
Vimentin. FLAG/Luc/#1. FLAG/Keap1/#1. FLAG/Luc/#1 FLAG/Keap1/#1. B. Supplemental Figure 1. A. Supplemental Figure 2. GSH. 25,000,000. 20,000,000. Relative Intensity. 15,000,000. 10,000,000. 5,000,000. 0. Control. Nrf2 shRNA/#2. Levels of ROS. A. B. Control.

E N D
Vimentin FLAG/Luc/#1 FLAG/Keap1/#1 FLAG/Luc/#1 FLAG/Keap1/#1 B Supplemental Figure 1 A
Supplemental Figure 2 GSH 25,000,000 20,000,000 Relative Intensity 15,000,000 10,000,000 5,000,000 0 Control Nrf2 shRNA/#2 Levels of ROS A B Control Nrf2 shRNA Cell Number C400 Control shRNA Nrf2 shRNA/#2 C Number x 10
Nrf2 shRNA #2 Control shRNA pAKT AKT C-Jun Cyclin D1 GAPDH Supplemental Figure 3
A549 cells Control lentivirus shRNA Lentivirus Nrf2 shRNA clone 3 Lentivirus Nrf2 shRNA clone 6 Nrf2 Cell Number GAPDH Control Clone 3 Days Lentivirus Nrf2 shRNA clones Supplemental Figure 4 B Clone 6
Supplemental Figure 5 Nrf2 shRNA Control shRNA
0 hr 24 hr 24 hr 5 ng/ml TGF- SB431532 + TGF- Supplemental Figure 6 B A Control retrovirus shRNA Nrf2 siRNA in pSilencer Retrovirus Nrf2 shRNA #2 Control siRNA in pSilencer O hr 24hr 24 hrs C
24 hrs + TGF- 24 hrs TGF- + SIS3 Supplemental Figure 7
Supplemental Figure 8 Micro-Taur schematic diagram “A” side media ports Cell loading port “B” side media ports • 6 micron posts • 8 micron posts • 10 micron posts • 12 micron posts Post-containing chambers Insert illustrating Post Region (12 micron)
Supplemental Figure 9 2500 2000 1500 TGF-1 pg/ml 1000 500 0 Control shRNA Nrf2-shRNA #2
A B Loss of Nrf2 expression TGF β TGF β E-Cadherin ROS ROS Phosphatases P P P P P P Phosphatases PP PP PP PP MH2 MH2 MH2 MH2 MH1 MH1 MH1 MH1 MH2 MH1 R-Smad R-Smad R-Smad R-Smad R-Smad pR-Smad pR-Smad pR-Smad Smad4 Smad4 Smad4 Nrf2 Smad target genes Smad target genes Nrf2 Nrf2 Slug Slug Smad target genes Supplemental Figure 10 E-Cadherin