Download

1 / 16
160 likes | 231 Vues
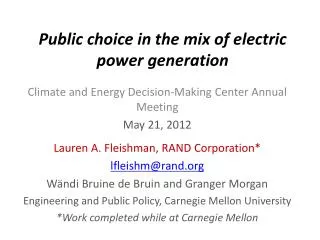
Public choice in the mix of electric power generation. Climate and Energy Decision-Making Center Annual Meeting May 16, 2011 Lauren A. Fleishman lauren@cmu.edu Wändi Bruine de Bruin and Granger Morgan Engineering and Public Policy, Carnegie Mellon University.

E N D
Public choice in the mix of electric power generation Climate and Energy Decision-Making Center Annual Meeting May 16, 2011 Lauren A. Fleishman lauren@cmu.edu WändiBruine de Bruin and Granger Morgan Engineering and Public Policy, Carnegie Mellon University
Public acceptance can be a major obstacle to energy infrastructure development midtownbrews.net • People hold gaps and misconceptions about low-carbon electricity technologies… • Many public opinion studies provide un- or under-informed and unreliable results • In two studies, we have aimed to: • Better inform people about low-carbon electricity technologies and portfolios • Overcome the barriers of their misconceptions and knowledge gaps • Elicit preferences informed by correct and balanced information www.nuclear-free.com http://blogs.chron.com
Participants receive “homework materials” that … • are technically accurate and understandable • present 10 electricity technologies • provide multi-attribute descriptions of the costs, risks and benefits of each technology • facilitate the ranking of technologies at home Materials: http://www.cedm.epp.cmu.edu/tool-public-lowcarbon.php
In a first study, participants asked to rank pre-determined low-carbon portfolios before and after a group discussion Mean participant portfolio rankings (±SD), from 1 (best) to 7 (worst) Fleishman LA, Bruine de Bruin, W and Morgan, MG. (2010) Informed Public Preferences for Electricity Portfolios with CCS and Other Low-Carbon Technologies, 2010, Risk Analysis, 30(9):1399-1410.
In a second study, participants are asked to create a low-carbon portfolio with a decision tool “…build a combination of new power plants [to meet increased demand] that you think is the best…[It] must make 60 TWh of electricity per year, but release 50% of the CO2 that would have been released using the original plan [current PA energy mix].”
Compare Screen Participants designed portfolios before and after a group discussion When you have saved 3 combinations you like, hit the “compare” button. Compare the combinations and decide which one you would like to use as “your advice to the governor”
Participants 10 Workshops: • Held at local community organizations • Including 4-9 participants each • Lasting 2.5 – 3.5 hours • Carefully scripted following Risk Ranking procedures • Paid $95 (to keep or donate to organization) 69 Participants: • Ages 22 to 85 years old (m=53.9) • 70% Females, 13% African-American or other minority • All had HS diploma, 58% at least a Bachelor’s degree
Technology Rankings Graph shows mean participant technology rankings (±SD), from 1 (best) to 10 (worst) • Energy efficiency, nuclear, IGCC with CCS and natural gas were not ranked significantly different from one another • Both coal technologies with CCS were ranked better than IGCC and PC • IGCC with CCS ranked better than PC with CCS Note: Superscripted letters next to mean technology rankings refer to Wilcoxon paired-rank tests results (p < 0.01), suggesting that: a: PC with CCS, Wind, PV Solar, IGCC, PC with biomass and PC were ranked significantly worse b: PC with CCS, PV Solar, IGCC, PC with biomass and PC were ranked significantly worse c: PV Solar, IGCC, PC with biomass and PC were ranked significantly worse d: IGCC, PC with biomass and PC were ranked significantly worse e: PC with biomass and PC were ranked significantly worse f: PC was ranked significantly worse
Portfolio Designs Participants’ mean standardized technology percentages ± standard deviation, where 0 is no inclusion and 100 is full inclusion in portfolio Note: Superscripted letters next to mean standardized technology percentages refer to t-test results (p < 0.01) suggesting that standardized technology percentages of: a: natural gas, IGCC with CCS, wind, PC with CCS, PV solar, PC, IGCC, and PC with biomass were significantly less b: IGCC with CCS, wind, PC with CCS, PV solar, PC, IGCC, and PC with biomass were significantly less c: PC with CCS, PV solar, PC, IGCC, and PC with biomass were significantly less d: PV solar, PC, IGCC, and PC with biomass were significantly less e: PC with biomass was significantly less f: all other technologies were significantly less g: wind, PC with CCS, PV Solar, PC, IGCC, and PC with biomass were significantly less
Portfolio Designs Most common portfolio, on average, post-discussion • Participants had to include at least one low-carbon baseload technology (natural gas, coal with CCS, nuclear) in portfolio • Most frequent design included all three (58.2% pre-discussion, 60.3% post-discussion) • The most common portfolio included energy efficiency, nuclear, natural gas, wind and coal with CCS (31% pre-discussion, 38% post-discussion)
Overall Conclusions • It is possible to design communications to inform people about the costs, risks, benefits and limitations of low-carbon electricity technologies and portfolios • Our informed participants • designed diverse portfolios including nuclear, CCS, energy efficiency, wind and natural gas – similar to EPRI full • preferred coal with CCS to coal without CCS • Results contrast those of other studies showing much lower preference of CCS and nuclear • our participants were given balanced and comparative information and adequate time EPRI full portfolio Source: www.epri.com
Thank You! Lauren A. Fleishman, PhD Engineering and Public Policy, Carnegie Mellon University lauren@cmu.edu Fleishman LA, Bruine de Bruin, W and Morgan, MG. Informed Public Preferences for Electricity Portfolios with CCS and Other Low-Carbon Technologies, 2010, Risk Analysis 30(9):1399-1410. Materials: http://www.cedm.epp.cmu.edu/tool-public-lowcarbon.php Funding provided by:
Group Workshop Procedure Experimenter explanation of “homework” materials & introduction of computer tool Group discussion: Participants present portfolio designs on a projected “Compare” screen
Participant comprehension and satisfaction • 24 true-or-false homework knowledge questions • M=90%, SD=11%, range: 46-100% • Scores significantly better than chance (t=28.2, p < 0.001) • 13 computer knowledge questions • M = 93%, SD = 10%, range 62-100% • Participants thought that using the computer tool was: • “an enjoyable experience” (M=6.5, SD=1.0, t=20.3, p<0.001) and “a valuable use of [their] time” (M=6.4, SD=1.2, t=17.9, p<0.001) • They “learned a great deal about the different electricity options” (M=6.4, SD=1.2, t=16.3, p<0.001)