Download
1 / 38
390 likes | 584 Vues
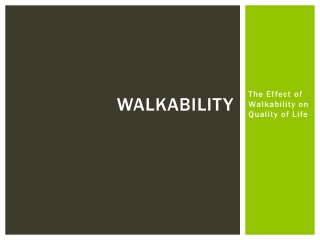
Neighbourhood Walkability and Physical Activity Levels in Canadian Communities. Justin Thielman Michael Lebenbaum Laura Rosella Ray Copes Heather Manson. Outline of Presentation. Background and Research Gaps Data Sources and Methods Results Discussion. Background and Research Gaps.

E N D
Neighbourhood Walkability and Physical Activity Levels in Canadian Communities Justin ThielmanMichael LebenbaumLaura RosellaRay CopesHeather Manson
Outline of Presentation • Background and Research Gaps • Data Sources and Methods • Results • Discussion
Background and Research Gaps HIGH WALKABILITY LOW WALKABILITY
Background and Research Gaps • Recent systematic reviews show some evidence of associations between walkability and some types of physical activity, but not conclusive [12-19] • Non-significant estimates of associations identified in many studies may be due to type II error [16,18] • Almost all studies done in one or two large metropolitan cities, so not generalizable to smaller centres [15,16,18-20]
Background and Research Gaps • Our study uses national-level data sources that cover all of Canada • Large sample size • Diverse range of city sizes • Cross-Canada representation • Research Questions: • Is walkability associated with walking for transportation or total leisure and transportation physical activity among Canadians aged 12 and older? • How, and to what extent are these associations affected by variables such as age of respondent and city size?
Data Sources and Methods • Canadian Community Health Survey (CCHS): • The CCHS is a national survey of health, health determinants, and health care utilization among Canadians aged 12 and older • Primary outcomes: • Walking to work or school • Energy expenditure on transportation and leisure physical activity • Covariates: • Age, sex, race, immigration, income, education level, children in household, location, work or school attendance, population centre size class
Data Sources and Methods Walkability data: Street Smart Walk Score (SSWS) (www.walkscore.com) Restaurants/bars Grocery stores Coffee shops For given locations, SSWS algorithm based on number and proximity of amenities Parks Clothing/gift shops Schools Book stores Entertainment Banks Penalties for lower intersection densities and longer block lengths
Results All Respondents: Walked to Work or School in Past 3 Months SSWS Quintile Odds Ratio Forest plot based on multivariable analyses adjusting for age, sex, race, working or attending school, immigration to Canada, highest level of education, household income, number of children under 12, population centre size category
Age 18-29: Walked to Work or School in Past 3 Months Age 12-17: Walked to Work or School in Past 3 Months SSWS Quintile SSWS Quintile Odds Ratio Odds Ratio Age 30-64: Walked to Work or School in Past 3 Months Age 65+: Walked to Work or School in Past 3 Months SSWS Quintile SSWS Quintile Odds Ratio Odds Ratio Each analysis adjusted for sex, race, working or attending school, immigration to Canada, highest level of education, household income, number of children under 12, population centre size category
Population 1,000-29,999: Walked to Work or School Population 30,000-99,999: Walked to Work or School SSWS Quintile SSWS Quintile Odds Ratio Population 100,000+ : Walked to Work or School Odds Ratio SSWS Quintile Each analysis adjusted for age, sex, race, working or attending school, immigration to Canada, highest level of education, household income, number of children under 12 Odds Ratio
Results All Respondents: Transport and Leisure Physical Activity • Similar results in age and population subgroups: • +ve assoc. for Q4 & Q5: • Age 30-64 • Pop. 1,000-29,999 • +ve assoc. for Q5 only: • Age 18-29 • Pop. 100,000+ • No significant assoc. • Remaining groups SSWS Quintile Difference in Energy Expenditure (kcal/kg/hr) Forest plot based on multivariable analyses adjusting for age, sex, race, working or attending school, immigration to Canada, highest level of education, household income, number of children under 12, population centre size category
Discussion • Limitations: • Information bias due to self-reported outcomes • Selection bias due to residential self-selection • Residual confounding • Cross-sectional study design precludes inference of causality
Discussion • SSWS and walking to work or school: • Positive associations identified for all quintile comparisons, increasing strength in each successive quintile • Consistent across age groups and population centre sizes • SSWS and energy expenditure on all leisure and transport activities: • Compared to lowest quintile, only top quintile shows positive association • Next steps: • Findings can be used to justify more resource-intensive longitudinal studies in a variety of age and population groups
Thank you! Questions? justin.thielman@oahpp.ca
References [1] Chronic Diseases and Their Common Risk Factors. (n.d.). In World Health Organization. Retrieved July 8, 2011 from http://www.who.int/chp/chronic_disease_report/media/Factsheet1.pdf [2] Lynch, B.M., Neilson, H.K., Friedenreich, C.M. (2011). Physical activity and breast cancer prevention Recent Results in Cancer Research. 186:13-42. [3] Lee, L.L., Watson, M.C., Mulvaney, C.A., Tsai, C.C., Lo, S.F. (2010). The effect of walking intervention on blood pressure control: a systematic review. International Journal of Nursing Studies. 47(12):1545-1561. [4] Murtagh, E.M., Murphy, M.H., Boone-Heinonen, J. (2010). Walking: the first steps in cardiovascular disease prevention. Current Opinion in Cardiology. 25(5):490-6. [5] Halle M, Schoenberg MH. (2009). Physical activity in the prevention and treatment of colorectal carcinoma. DeutschesAerzteblatt International. 106(44):722-7. [6] Caspersen CJ, Fulton JE. (2008). Epidemiology of walking and type 2 diabetes. Medical & Science in Sports & Exercise. 40(7 Suppl):S519-28. [7] Ferrier, S., Blanchard, C.M., Vallis, M., Giacomantonio, N. (2011). Behavioural interventions to increase the physical activity of cardiac patients: A review. European Journal of Cardiovascular Prevention and Rehabilitation. 18(1):15-32. [8] Foster, D.D., Summers, A.A. (2008). State executive/legislative and judicial activities and the strength of local regulation of residential housing. Urban Lawyer 40(1):1-16.
References [9] Hui, E.C.M., Lam, M.C.M., Ho, V.S.M. (2006). Market disequilibrium and urban land shortages: Analysis of policy and patterns in Hong Kong. Journal of Urban Planning and Development. 132(2):80-88. [10] Hiwasaki, L. (2005). Toward sustainable management of national parks in Japan: Securing local community and stakeholder participation. Environmental Management. 35(6):753-764. [11] De Vries, M.S. (2002). The changing functions of laws and its implication for government and governance. International Review of Administrative Sciences. 68(4):599-618. [12] Wendel-Vos W, Droomers M, Kremers S, Brug J, van Lenthe F. Potential environmental determinants of physical activity in adults: a systematic review. Obesity Reviews. 2007; 8(5):425-440. [13] Durand, C.P., Andalib, M., Dunton, G.F., Wolch, J., Pentz, M.A. A systematic review of built environment factors related to physical activity and obesity risk: Implications for smart growth urban planning. Obesity Reviews. 2011; 12(501):e173-e182. [14] Foster, C., Hillsdon, M. Changing the environment to promote health-enhancing physical activity. Journal of Sports Sciences. 2004; 22:755-769. [15] Saelens, B.E., Handy, S.L. Built Environment Correlates of Walking: A Review. Medicine and Science in Sports and Exercise. 2008; 40(7):S550-S566. [16] Sugiyama T, Neuhaus M, Cole R, Giles-Corti B, and Owen N. Destination and Route Attributes Associated with Adults’ Walking: A Review. Med. Sci. Sports Exerc. 2012; 44(7):1275-1286
References [17] McCormack C, and Shiell A. In search of causality: a systematic review of the relationship between the built environment and physical activity behaviour. International Journal of Behavioral Nutrition and Physical Activity. 2011; 8:125. [18] Van Cauwenberg J, De Bourdeaudhuij I, De Meester F, Van Dyck D, Salmon J, Clarys P, Deforche B. Relationship between the physical environment and physical activity in older adults: A systematic review. Health & Place. 2011; 17:458-469. [19] Frost, SS, Goins RT, Hunter RH, Hooker SP, Bryant LL, Kruger J, Pluto D. Effects of the Built Environment on Physical Activity of Adults Living in Rural Settings. American Journal of Health Promotion. 2010; 24(4):267-283. [20] Sallis JF, Floyd MF, Rodriguez DA, Saelens BE. Role of Built Environments in Physical Activity, Obesity, and Cardiovascular Disease. Circulation. 2012; 125:729-737. [21] Statistics Canada. Canadian Community Health Survey, 2009-2010: Annual component [Data file and code book]. 2011. [22] Statistics Canada. Canadian Community Health Survey, 2007-2008: Annual component [Data file and code book]. 2009. [23] Statistics Canada. Canadian Community Health Survey, 2009-2010: Annual component [User Guide]. 2011. [24] Walk Score. Walk Score Methodology. 2012. [25] Duncan DT, Aldstadt J, Whalen J, Melly SJ, Gortmaker SL. Validation of walk score for estimating neighborhood walkability: an analysis of four US metropolitan areas. Int J Environ Res Public Health. 2011 Nov;8(11):4160-79. [26] Carr LJ, Dunsiger SI, Marcus BH. Validation of Walk Score for estimating access to walkable amenities. Br J Sports Med. 2011 Nov;45(14):1144-8.
Next steps • Climate covariates • CHMS