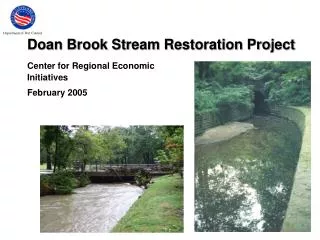
Download
1 / 45

E N D
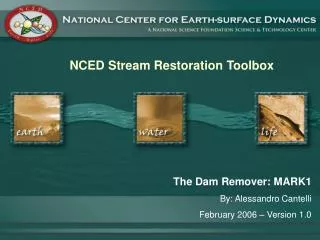
The Stream Restoration Toolbox The Stream Restoration Toolbox consists of current basic research cast into the form of tools that can be used by practitioners. The details of a tool are presented through a PowerPoint presentation, augmented by embedded Excel spreadsheets or other commonly available applications. The toolbox is a vehicle for bringing research findings into practice. While many tools are being developed by NCED Researchers, the opportunity to contribute a tool to the Toolbox is open to the community. For more information on how to contribute please contact Jeff Marr at marrx003@umn.edu.
Statement of liability and usage • This tool is provided free of charge. Use this tool at your own risk. In offering this tool, the following entities and persons do not accept any responsibility or liability for the tool’s use by third parties: • The National Center for Earth-surface Dynamics; • The universities and institutions associated with the National Center for Earth-surface dynamics; and • The authors of this tool. • Users of this tool assume all responsibility for the tool results and application thereof. The readers of the information provided by the Web site assume all risks from using the information provided herein. None of the above-mentioned entities and persons assume liability or responsibility for damage or injury to persons or property arising from any use of the tool, information, ideas or instruction contained in the information provided to you.
Title Page Tool Title: Appropriate Use of Bank Stabilization For River Rehabilitation Tool Author: J. Wesley Lauer Author e-mail: laue0050@umn.edu Version: 1.0 Associated files: 1) BankStabilizationDiagnosisTool.ppt Date: March 2006
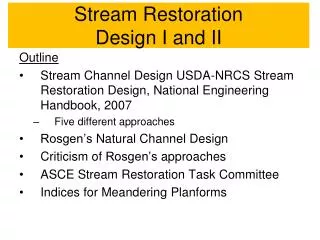
Outline of this Document • Appropriate Use • Purposes of Bank Protection • Protect Bank-top Property • Protect or Rehabilitate Habitat • Mitigate a Downstream Sedimentation Problem • Prevent Contaminated Soil from Entering a Stream • Other reasons bank protection projects are built • Using bank protection to mitigate a sedimentation problem • Step 1: Characterize the downstream sedimentation problem • Step 2: Perform initial screening based on bankfull geometry • Step 3: Estimate total input rate of sediment from the high banks. • Step 4: Determine the river’s load in the size class of sediment causing the problem • Step 5: Compare sediment input with what the stream conveys. • Step 6: Morphodynamic analysis • A worked example: The Vermillion River, Minnesota • Conclusion • References
Appropriate Use of Bank Stabilization For River Rehabilitation: A Diagnostic Tool Bank stabilization is often a significant component of river restoration and rehabilitation projects both in terms of total cost and project footprint. However, in their natural state, rivers generally migrate freely across their floodplains, with eroding banks representing the norm rather than the exception. This raises the following question: When is it appropriate to consider bank stabilization as part of a river rehabilitation project? This presentation/tool presents a methodology for answering this question.
Purposes of Bank Protection 1) Protect Bank-top Property This is invariably a primary reason for bank stabilization work. However, protecting bank top property can not strictly be considered restoration of a river system, unless the project is installed as part of a newly constructed restoration project to keep the channel within the bounds of the project. While protecting bank-top property is usually not restoration, it is often necessary and should be performed in an ecologically sensitive manner.
1998 Purposes of Bank Protection 2) Protect or Rehabilitate Habitat Example: San Luis Obispo Creek, California In many salmon bearing streams, summertime water temperatures play an important role in the overall quality of the habitat. Shading of the open water can reduce temperatures and improve habitat suitability, so it can be beneficial to stabilize and revegetate eroding banks, thereby allowing a canopy to become established. This is particularly true when relatively dry conditions at the top of the bank or existing unplanted revetments prevent vegetation from growing. 1999 2004 2004 Images courtesy Questa Engineering Corp., Richmond, CA
Another example of bank stabilization with aquatic habitat rehabilitation as one of the goals, San Luis Obispo Creek, California 1998 2004 1999 Images from Questa Engineering Corporation, Richmond, CA
Purposes of Bank Protection 3) Mitigate a Downstream Sedimentation Problem In most natural meandering systems, eroding banks are not long-term net sources of sediment. On average, what is eroded from cut banks is generally replaced elsewhere in the floodplain as either point bar or overbank deposits. However, on incised streams, bank erosion is associated with widening of the incised channel and therefore does represent a net source of sediment. In cases where the downstream water body has too much sediment, it might be appropriate to stabilize the banks of the incised channel. (However, this prevents the channel from developing a new, more active and ecologically important floodplain.) Streambank prior to stabilization on a deeply incised portion Corinda Los Trancos Creek near Half Moon Bay, CA.
Purposes of Bank Protection 4) Prevent Contaminated Soil from Entering a Stream Since floodplains act as buffers for the sediment carried by a stream system, they can store contaminants that the stream may have conveyed in the past. Bank erosion can release the contaminated sediment, so, short of removing much of the floodplain, bank protection represents an effective way of preventing the contaminants from re-entering the channel and being transported downstream. The floodplain of Silver Bow Creek, Montana, is contaminated with mine tailings derived from the Butte/Anaconda mining complex. The tailings prevent the establishment of riparian vegetation. Both bank stabilization and the wholesale excavation and removal of the contaminated sediment have been considered as potential solutions to the problem.
Other reasons bank protection projects are built: • Navigation (particularly channelization) • As part of grade stabilization projects—to prevent flanking of the controlling structure. • Landscaping • As scientific experiments • Politics While sometimes justifiable, none of these qualifies as a legitimate restoration or rehabilitation goal. They are consequently not considered by the rest of this presentation.
How do you know when you have a project meeting goals 2, 3, or 4 (habitat protection, reduction of sediment supply, or stabilization of contaminated sediment, respectively)? 4 simply requires contaminated sediment to be located on the floodplain in the direction of likely migration. This calls for measurements of floodplain contamination levels and an air photo analysis to determine the migration pattern (see River Planform Statistics tool in this toolbox). 2 requires knowledge of the ecology of a particular system and can not easily be dealt with in a generalized way. 3 is a very commonly cited justification for bank stabilization. Consequently, the rest of this presentation deals with how to identify eroding banks as contributing an excessive amount of sediment to a stream system.
Using bank protection to mitigate a downstream sedimentation problem In streams undergoing rapid incision, it is often obvious when the system is a significant source of sediment. In these systems, both the bed and banks represent the sediment source. Stopping the incision should be the primary goal of projects that are intended to reduce the downstream sediment supply. In these systems, the incision rate probably controls the net downstream supply more directly than any other single parameter. The incision rate and downstream supply can be estimated using a model for 1-D channel sediment transport with geometrically defined lateral supply such as that included in Parker’s E-book (Parker 2004) or the USDA CONCEPTS model1. Detailed explanation of these models is beyond the scope of this presentation. Eroding streambank along incised channel of Papillion River, Nebraska. From Langendoen and Simon, 2000. 1 The CONCEPTS model is available at http://msa.ars.usda.gov/ms/oxford/nsl/agnps/Concepts/concepts.html
Meandering streams with large active floodplains lie on the other end of the spectrum from rapidly incising streams. Most of the banks adjacent to the active floodplain are relatively low and do not supply much sediment to the channel. What they do supply us usually redeposited elsewhere in the system, leaving little sediment to be exported downstream. In the real world, there is a continuum between incised channels whose banks obviously supply a significant volume of sediment and migrating channels with large active floodplains whose bank erosion does not result in much, if any, net downstream supply. This tool provides a geometrically based methodology for characterizing banks in the middle of this continuum—streams that migrate laterally at observable rates into banks that are not part of the active floodplain. Its goal is to help identify whether stabilizing a given eroding bank or set of banks is justifiable as mitigation for a downstream sedimentation problem. Image of the relatively wide floodplain of the Neuse River, North Carolina.
A 6-step program: (Note: in many cases, it is prudent to first perform order of magnitude calculations before investing significant resources into the analysis only to find that bank supply is relatively unimportant.) Step 1: Characterize the downstream sedimentation problem Step 2: Perform initial screening based on bankfull geometry to identify banks not part of the active floodplain. (Avoid stabilizing banks on the active floodplain – this probably causes more ecological harm than good.) Step 3: Estimate net input of sediment from the high banks. Step 4: Determine the load carried by the river Step 5: Compare sediment input from banks with the stream’s load. Step 6: In some cases, perform morphodynamic analysis or install grade control structures to ensure that removing the lateral source will not lead to excessive downcutting. If erosion still appears important, and stabilizing it won’t cause problems identified in step 6, go ahead with the stabilization.
Step 1: Characterize the downstream sedimentation problem Is the problem one of fine sediment (turbidity, clogging of spawning gravels, nutrients adsorbed to fine sediments, etc.) or of coarse sediment (downstream bed aggradation, excessive downstream channel movement, etc.)? No problem: STOP, don’t stabilize the banks unless there are other justifiable reasons. Bank erosion is a natural process and should generally be allowed to occur if there is no reason to interfere. This may rule out projects on many incised systems since they often can handle the extra sediment. The Red River of the North near Fargo, North Dakota, experiences chronic high turbidity levels. The problem is associated with high concentrations of fine suspended sediment (although upland sources are probably more important than banks for this system).
Step 2: Perform initial screening based on bankfull geometry to determine whether the banks are likely to be a net source of the sediment (i.e. are not part of the active floodplain) In the context of an active river/floodplain system, erosion from streambanks associated with river migration is usually balanced by deposition elsewhere in the system, primarily in point bars and overbank deposition on the floodplain or in floodplain lakes. Consequently, streams in undisturbed landscapes might not be expected to gain much sediment from bank erosion. However, particularly where streams are incised and are widening their floodplains by migrating into high terraces, bluffs, or the old banks of the incised channel, it is possible for them to gain sediment from banks. A channel/floodplain system on an unnamed river in Siberia. Red arrows denote locations where the channel is eroding into bluffs and is probably receiving more sediment over the long term than it replaces in the floodplain. Most of the other banks are probably not net sources of sediment.
In the previous example, it is obvious where the channel is migrating into a non-alluvial surface and gaining sediment. However, it can sometimes be difficult to draw the distinction when the higher surface is simply an abandoned terrace a meter or two above the rest of the floodplain. To identify these sites, it is best to determine a bankfull channel elevation and look for banks that are significantly higher than this elevation. Even with good topography, it can be difficult to determine exactly what qualifies as a terrace and what qualifies as old but still active floodplain as illustrated by this image of the floodplain of the Vermillion River in Minnesota. Terrace or Floodplain? Terrace
Deal with the preceding problem by identifying bankfull elevation Contrary to the prevailing opinion, river banks do not develop at a single, constant height above the mean bed level. Instead, there is significant natural variability between the elevation of the outer bank and the inner bank even within an active floodplain. Furthermore, the banks on a given side of the channel tend to change height in the down-channel direction. The above show the banks of the Vermillion River near Empire, Minnesota. Note the difference in elevation between the outer cut bank and inner point bar bank in the photo. Also note the variability in bank height in the down-channel direction.
Bankfull Stage at Break in Slope A rating curve developed from a nearby gauge is a good bankfull indicator for a system with a well defined floodplain, but may not work well for a system that is incising. The justification here is that the total conveyance capacity of a channel/floodplain system increases as the floodplain starts conveying flow. At this point, additional discharge results in a smaller increase in depth than would occur if the flow was still confined within the channel banks. On incised systems, the break in slope would occur at the level of the abandoned floodplain. Note that bankfull stage for the Vermillion River is on the same order as the fluctuations in bank elevation shown on the previous slide.
If no gauge is available, or if the stream can be shown to have incised recently, the next best indicator in many systems is perhaps the vegetation line on point bars. In general, this probably underpredicts the bankfull stage obtained using the rating curve method, even for systems that are not incised. Furthermore, it will not work well in deeply incised channels that have recently experienced a large, erosive flood that has stripped out the vegetation. In such highly incised systems, the concept of bankfull breaks down since the banks were not built by the present channel. The best indicator in these systems of a “natural” top-of-channel level is possibly the depth of flow at the effective discharge (the discharge responsible for moving more sediment than any other discharge, Goodwin 2004) or at the discharge below which 50% of a channel’s load is conveyed (the two are not the same, see Vogel et al. 2003). However, for the purposes of the present analysis, using a fairly frequent flood discharge (i.e. something like the the 1.5 to 2 year event) is probably sufficient. Arrow indicates upper limit of bare sediment on the point bar. This can be used as a proxy for bankfull elevation in ungauged meandering systems.
Banks that are less than 25% above bankfull height are probably part of the active floodplain and are thus unlikely to be significant net sources of sediment after point bar and overbank deposition are considered. This somewhat arbitrary threshold is based on the variability of bank elevation along 63 km of channel through the floodplain of the Bogue Chitto River, LA (floodplain topography from Lidar illustrated at right)
Elevation along left bank for 63 km of the Bogue Chitto River, LA. The portions of the river eroding into valley walls have been removed from the plot, so that the plot represents only the active portion of the floodplain.
After detrending using a best-fit 5th order polynomial, it is still obvious that there is much variability in bank height. However, about 95% of banks are less than 25% above the bankfull stage of about 3 m. It is thus a good bet that banks in this system less than 25% above bankfull are part of the active floodplain and thus are probably not net sediment sources. Unless other data is available, this can be used as a crude rule-of-thumb.
Outer bank at time t + Δt Eroded Area Ae Deposited Area Ad Inner bank at time t + Δt Outer bank at time t Inner bank at time t Step 3: Estimate total input rate of sediment from the high banks. Method A: Polygon analysis in GIS of two air photos. This method is most appropriate where only a small number of banks are being considered, and the elevation of each cut bank and corresponding point bar is relatively constant. In this case, simply draw lines defining the banks for a historic air photo and a recent air photo that have been rectified to each other and compute the area and representative elevation for each of these polygons.
Outer bank at time t + Δt Eroded Area Ae Deposited Area Ad Inner bank at time t + Δt Outer bank at time t Inner bank at time t To compute the net erosion rate, use the following: E = (Aeηe - Adηd )/Δt Where Ae and Ad are the areas eroded and deposited, respectively, between photos, ηe and ηd are the mean elevations, respectively of the eroding and depositing surfaces. The elevation ηd should correspond with the elevation of the local vegetation line. The problem with this method is that ηe is sometimes not available and has to be determined based only on existing topography.
Method B: Discretized analysis using local migration rates • This method is best suited to systems where net erosion from a large number of banks is desired and where detailed bank topography is available. It attempts to get around the problem of the potentially variable elevation of the eroding bank by computing an instantaneous erosion rate based on existing observed elevations. It requires the approximation of the existing instantaneous outward normal migration rate at discretized points along the channel. See Lawler (1993) for a review of migration measurement techniques. The method computes the net erosion rate as follows: • where ci is the local outward normal migration rate at point i, ηe,i and ηd,i are the respective elevations of the eroding and depositional banks at i, and Le,i and Ld,i are the respective lengths of the eroding and depositional banks at i. • A GIS based tool has been developed to determine migration rates ci and bank lengths Le,i and Le,i along evenly spaced intervals down a channel. This tool will be presented separately. For a small number of banks, the analysis can be completed by hand, but method A may be simpler.
Definition of terms used in Method B Channel Centerline at t+Δt Le,i i-1 i i di i+1 Channel Centerline at t Ld,i ci = di/Δt Where di is the length of the trajectory of outward normal bank migration and Δt is the representative time period.
Channel Centerline at t di,int Channel Centerline at t +Δt A caveat to Method B: The bank migration trajectory changes direction near the apices of bends that translate primarily downstream. This is particularly likely where the channel is migrating into a high valley wall that slows outward migration. A simple way to deal with this is to interpolate centerlines near apices that have translated downstream, as shown here, and measure ci based on the short-term trajectory near the bend apex. ci = di,int/Δtint where di,int is the trajectory length between the most recent interpolated centerline and the existing centerline, and Δtint is the time period between those lines. In this case, Δtint = Δt/2. This correction is also important just downstream of the point that the trajectory changes direction, since the rate slows just before the direction change. A method for applying this correction is discussed in the separate Planform Statistics Tool.
It is possible to apply the techniques described in step 4 to active portions of the floodplain. If this is done, the analysis will usually show that the banks are a net source of sediment (although probably a minor one). However, if the banks are part of the active floodplain, the material they supply will very likely be deposited elsewhere in the floodplain. Stabilizing them will disrupt this process and has lead to significant ecological problems related to sedimentation on the floodplain and the associated loss in diversity in morphological form in many of the larger river systems in the world (see Sparks, 1995, Gore and Shields, 1995). It can also conceivably lead to sediment starvation in the downstream system, causing channel incision there. An Important Point
Step 4: Determine the river’s load in the size class of sediment causing the problem Ideally, use gauge data such as are available from the USGS (at right, see Ferguson 1986). If bed material-sized sediment is of interest, it is possible to use a bed material load equation to provide a rough estimate. Regional sediment yield studies can be used in the absence of gauge data. USGS suspended sediment gauge data for the Neuse River, NC.
Step 5: Compare sediment input with what the stream conveys. Compute the fraction of the total load computed in Step 4 that the eroding banks represent. With this, it is possible to compute the length of similar banks needed to be stabilized to have significant impact on the sedimentation problem. Where L is the length of similar banks that would have to be stabilized to reach the sediment transport rate goal Qs,goal (m3/yr), Qs is the existing sediment transport rate (m3/yr), E is the erosion rate computed in step 4 (m3/yr), and Le is the length of the eroding bank used to compute E. This can all be done on a grain size specific basis if Qs, Qs,goal, and E represent sediment transport rates in the size class causing the problem. In channels that have not incised much, L will often be quite large, indicating that stabilizing individual banks will have a very small effect on the overall sediment load. In these cases, it is probably best to look for another sediment source that can be stabilized, since allowing banks to erode will ultimately lead to the creation of a new floodplain that is more in equilibrium with the current hydrologic regime.
Step 6: Morphodynamic analysis • Before stabilizing the banks, make sure that the bed will not rapidly degrade as soon as the lateral source is removed. This may require a 1-D sediment transport analysis or the provision of grade control structures. This is probably most important where the banks of incising streams are going to be stabilized. • This is particularly important if much of the material eroding from the banks is as large or larger than the size of the material on the bed of the stream. Image of Little Wekiva River, near Orlando, Florida. The channel incised due to urbanization of its watershed. Grade control was required along with bank stabilization to protect nearby property. From Parker’s E-book, Chpt. 15.
A worked example: The Vermillion River, Minnesota (additional photos and data shown on pages 19-22) • The Vermillion River is a small meandering river located south-central Minnesota at the southern edge of the Minneapolis/St. Paul metropolitan area. Some of the clearly eroding banks on the Vermillion appear to be significantly higher than the rest of the floodplain. How much sediment might these banks be contributing, and how much would the sediment load be reduced if these banks were stabilized? • Detailed bank elevation and channel migration data was obtained for the river from aerial remote sensing (elevations from Lidar survey, summer 2004 and migration rates from aerial photographs taken in 1987 and 2003). Net supply from the high banks is computed according to Method b (page 23). While the computations are straightforward, spreadsheets illustrating the method are embedded in this presentation.
Step 1: Is there a sedimentation problem? • This is not clear on the Vermillion River, but if present, the problem probably relates to fine, easily suspended sediment causing high turbidity levels. For the purposes of this example, we assume that turbidity is the primary management issue, and that the turbidity is caused by sediment less than 62.5 µm in diameter. We arbitrarily assume that watershed managers would like to reduce the average concentration of silt and clay particles by 50%. • Step 2: Initial screening to identify banks that are not part of the active floodplain. • Since detailed topographic data were available for this floodplain, it is possible to determine where cut banks are likely above the level of the active floodplain. Bankfull depth was taken to be 1.8 m based on a nearby gauge (see rating curve, p. 16). A mean bank elevation was determined from the bank elevation data and then offset upwards 0.25*1.8 = 0.45 m. Banks above this level were identified graphically, as shown on the next page.
Terrace Most of the banks in the 2.8 km reach under consideration fall below the crude top-of-active floodplain estimate of 1.25% of the bankfull depth (shown in red). However, one 44 m long bank is clearly above this level and is assumed to represent a floodplain terrace not likely to be rebuilt once it is eroded. The net supply of sediment from this terrace will be computed.
Step 3: Estimate total input rate of sediment from the high banks. Computation of net volumetric erosion rate was performed according to Method b (page 27). The results are shown below. Note that the method probably overestimates the net supply to the system from the eroding terrace because the newly deposited left bank is significantly lower than the typical bankfull level (see figure previous page), implying that it may soon capture additional sediment and could constitute a net sediment sink for some time as it slowly aggrades vertically. Such slow aggradation is probably the cause of much of the down-channel variability in bank height observed in this system. The computations shown here neglect this process.
Step 4: Determine the river’s load in the size class of sediment causing the problem Sediment load measurements from the Vermillion River were unavailable, so, for the purposes of this example, sediment yield estimates taken from Breach (1994) for the nearby Hay Creek watershed over the entire period since agricultural development (1851 to 1988) are used to get an order of magnitude estimate of the system’s sediment transport rate (see table, next page). While the estimate is probably high since agricultural sediment production has probably dropped in recent decades, it is acceptable for the purposes of an example. Alternatively, a sediment loss equation such as the Universal Soil Loss Equation and regional values for sediment delivery ratio could have been used to compute the load. We arbitrarily assume that 90% of the sediment yield is in the size class that could effect turbidity in the channel (<62.5 µm). We neglect sand and gravel since the example assumes that turbidity is related primarily to fine sediment.
Step 5: Compare bank sediment input with what the stream conveys. The length of banks similar to the selected high terrace that would need to be stabilized to achieve the sediment reduction goal is computed below. The results show that on the order of hundreds of kilometers of high terraces would need to be stabilized.
It is clearly impractical to stabilize hundreds of km of eroding banks on this system. While the relatively high sediment yield and load reduction goal used here could be partly responsible for such an extensive management prescription, even if the load reduction goal were two order of magnitudes smaller, it would still be difficult to stabilize enough high terraces along the Vermillion River to achieve the goal. The results show that the sediment supply from elsewhere in the watershed vastly outweighs the supply from terraces, implying that the erosion of old terraces is probably not a significant source of sediment (even though eroding terraces are present). For the Vermillion River, modifying naturally eroding banks such as the one shown below probably has virtually no effect on the fine sediment load carried by the channel. Note that since this example involved only fine sediment that would not interact with the bed and since the impact of stabilizing banks on the load is minimal, Step 6 was not performed.
Conclusion: Bank stabilization can be justified for many reasons, but providing a long-term reduction in sediment load is often low on the list. Consultants and funding agencies need to acknowledge this when justifying projects to clients and/or the general public. However, academics need to understand that projects like the one at right may be useful (by protecting property or providing scarce habitat) even though they may not result in a stream that interacts with its floodplain in a natural way. Photo from Alberta Fish Habitat Manual (http://www.trans.gov.ab.ca/Content/docType123/Production/fishhabitatmanual.htm )
References: Beach, T., 1994, The fate of eroded soil: sediment sinks and sediment budgets of agrarian landscapes in southern minnesota, 1985-1988, Annals of the Association of American Geographers, 84(1), 5-28. Ferguson, R. I., 1986, River loads underestimated by rating curves, Water Resources Research, 22(1), 74-76. Goodwin, P., 2004, Analytical solutions for estimating effective discharge. Journal of Hydraulic Engineering, 130(8), 729-738. Gore,J., and Shields, F.D., 1995, Can large rivers be restored?, Bioscience, 45(3), 142-152. Langendoen, E. J., and Simon, A., 2000, Stream Channel Evolution of Little Salt Creek and North Branch West Papillion Creek, Eastern Nebraska. US Department of Agriculture, Agricultural Research Service, National Sedimentation Laboratory, Oxford, MS. Lawler, D.M.,1993, The measurement of river bank erosion and lateral channel change: a review, Earth Surface Processes and Landforms 18, 777–821. Parker, G., 2004, 1D Sediment Transport Morphodynamics with Applications to Rivers and Turbidity Currents. http://cee.uiuc.edu/people/parkerg/ (October 27, 2005). Sparks, R.E., 1995, Need for ecosystem management of large rivers and their floodplains, Bioscience, 45(3), 168-182. Vogel, R.M., Stedinger, J.R., and Hooper, R.P., 2003, Discharge indices for water quality loads, Water Resources Research, 39(10), SWC 1-9.
Disclaimer Notice The information on this site is subject to a disclaimer notice. Thank you for visiting the National Center for Earth Dynamics Web site and reviewing our disclaimer notice. The Web site is for informational purposes only and is not intended to provide specific commercial, legal or other professional advice. It is provided to you solely for your own personal use and not for purposes of distribution, public display, or any other uses by you in any form or manner whatsoever. The information on this Web site is offered on an “as is” basis without warranty. The readers of the information assume all risks from using the information provided herein. • This tool is provided free of charge. Use this tool at your own risk. In offering this tool, the following entities and persons do not accept any responsibility or liability for the tool’s use by third parties: • The National Center for Earth-surface Dynamics; • The universities and institutions associated with the National Center for Earth-surface dynamics; and • The authors of this tool. • Users of this tool assume all responsibility for the tool results and application thereof. The readers of the information provided by the web site assume all risks from using the information provided herein. None of the above-mentioned entities and persons assume liability or responsibility for damage or injury to persons or property arising from any use of the tool, information, ideas or instruction contained in the information provided to you.
Want more information? For more information on this tool or the NCED Stream Restoration Toolbox please contact the author of this tool, J. Wesley Lauer, or the NCED Stream Restoration Project Manager, Jeff Marr at marrx003@umn.edu National Center for Earth-surface Dynamics 2 3rd Ave SE, Minneapolis, MN 55414 612.624.4606