Download
1 / 28
280 likes | 367 Vues
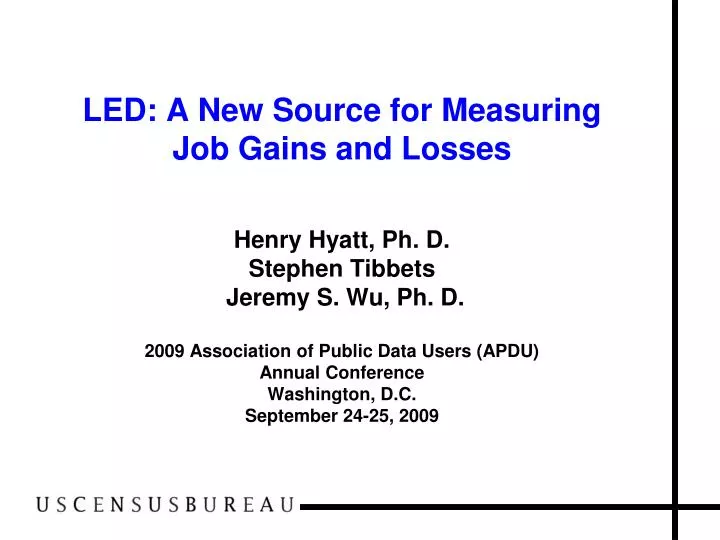
LED: A New Source for Measuring Job Gains and Losses Henry Hyatt, Ph. D. Stephen Tibbets Jeremy S. Wu, Ph. D. 2009 Association of Public Data Users (APDU) Annual Conference Washington, D.C. September 24-25, 2009. Major Federal Data Sources on Jobs/Employment.

E N D
LED: A New Source for Measuring Job Gains and LossesHenry Hyatt, Ph. D.Stephen Tibbets Jeremy S. Wu, Ph. D. 2009 Association of Public Data Users (APDU)Annual ConferenceWashington, D.C.September 24-25, 2009
How LED CalculatesNet Job Gains and Losses Jobs at Beginning of 2008Q4 minus Jobs at Beginning of 2007Q4 -------------------------------------------------------- Net Job Gains (or Losses) Note: This is defined as year-over-year, annual net job gains and losses
How LED CalculatesNet Job Growth Rate Net Job Gains (or Losses) ---------------------------------------------------- x 100% [Jobs at Beginning of 2008Q4 plus Jobs at Beginning of 2007Q4]/2
LED Current Scope LED Partners 51 Regular production 46* Experimental production (DC,VI) 2 Yet to supply data (CT, PR) 2 Data issues (NC) 1 Not yet partners (MA, NH) 2 ---------------------------------------------------------- National Partnership 53 *46 states represent about 92-93% of national employment
LED: Sample Calculations for Net Job Gains/Losses46 states, Private Sector, 2007Q4 – 2008Q4 103,908,614 – 105,857, 657 = -1,949,043 = -1,949,000 (round to nearest 1,000) Net Job Gains/Losses = -1,949,000
LED: Sample Calculations for Net Job Growth Rate46 states, Private Sector, 2007Q4 – 2008Q4 (103,908,614 – 105,857,657)*100% -1,949,043*100% (103,908,614 + 105,857,657)/2 104,883,136.5 = -1.85829971% = -1.9% (round to nearest 0.1%) Net Job Growth Rate = -1.9% =
LED: Net Job Gains and Growth Rate46 states, Private Sector, 2007Q4 – 2008Q4 Net Job Gains/Losses -1,949,000 Net Job Growth Rate -1.9%
LED: Net Job Gains and Job Growth Rates by State46 states, Private Industry, All Workers, 2007Q4 vs 2008Q4
LED: Net Job Gains and Growth Rates by Gender46 states, Private Sector, 2007Q4 – 2008Q4 Total may not agree due to rounding errors
LED: Net Job Gains and Job Growth Rates by State46 states, Private Industry, Female Workers, 2007Q4 vs 2008Q4
LED: Net Job Gains and Job Growth Rates by State46 states, Private Industry, Male Workers, 2007Q4 vs 2008Q4
LED: Distribution of Workers by Gender/Industry46 states, Private Sector, Beginning of 2008Q4
LED: Net Job Gains and Losses by Selected Industries/Gender46 states, Private Sector, 2007Q4 – 2008Q4 Total may not agree due to rounding errors
LED: Net Job Growth Rates by Selected Industries/Gender46 states, Private Sector, 2007Q4 – 2008Q4
LED: Net Job Gains and Losses by Age/Gender46 states, Private Sector, 2007Q4 – 2008Q4 Total may not agree due to rounding errors
LED: Net Job Growth Rates by Age/Gender46 states, Private Sector, 2007Q4 – 2008Q4
Age 14-18 Job Losses 44-45 Retail Trade 72 Accommodation and food services Age 35-44 Job Losses 31-33 Manufacturing 56 Admin and Support … 23 Construction 44-45 Retail Trade 52 Finance and Insurance Age 64-99 Job Gains 62 Health Care 44-45 Retail Trade 54 Professional, Scientific & Technical
Quarterly Workforce Indicators (QWI) • 30 QWIs produced routinely every quarter by combinations of • Worker Demographics • Gender, Age Groups • Industry • 2-digit, 3-digit and 4-digit NAICS • Geography • State, County, Workforce Investment Areas 20
Quarterly Workforce Indicators (QWI) • Among the 30 QWIs: • Beginning of Quarter Employment • Employed in Reference and Previous Quarters • Full Quarter Employment • Employed in Reference, Previous and Subsequent Quarters Note: Gross Job Creation, New Hires and Separations are available on a quarterly basis 21
Sample: Measuring Business-Cycle Employment Dynamics • Data: 33 States (70% of US Jobs) • Continuous reporting 1999Q1-2008Q4 • Beginning-of-Quarter Employment and Full-Quarter Employment • Net Job Growth Rate • Employment (T) - Employment (T-4) • ----------------------------------------------------- x 100% • [Employment (T) + Employment (T-4)]/2 22
Net Job Gains and Losses (33 states), Private Sector, 2000Q1 – 2008Q3 24
LED: Ongoing and Future Plans • Add data elements • race/ethnicity; education; firm age, size, and structure; occupation • Add data sources • Federal workers; self-employed • Enhance methodology/structure • Synchronize QWI with OnTheMap; state-based to national infrastructure • Build new data and products • Job-to-job flow statistics; national indicators; web-based tools
Contact Us • Comments/Suggestions • CES.local.employment.dynamics@census.gov • Local Employment Dynamics • http://lehd.did.census.gov • Join the Listservs • Lehd-qwi@lists.census.gov • Lehd-onthemap@lists.census.gov • Lehd-general@lists.census.gov 28 28