Download
1 / 52
540 likes | 926 Vues
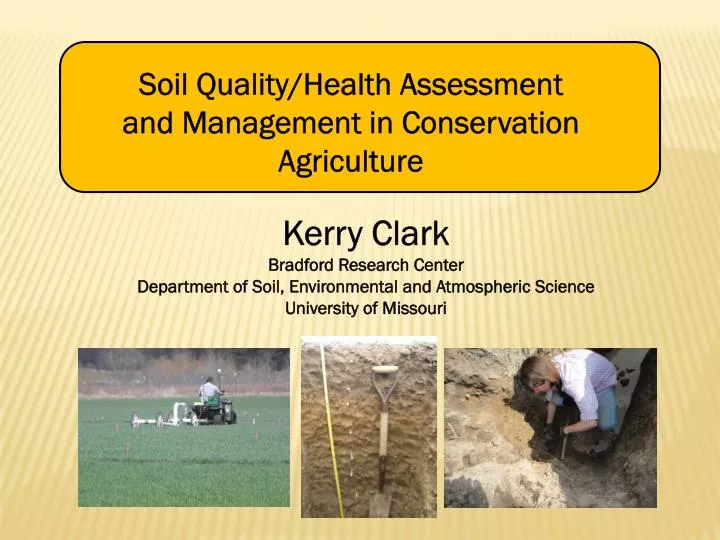
Kerry Clark Bradford Research Center Department of Soil, Environmental and Atmospheric Science University of Missouri. Soil Quality/Health Assessment and Management in Conservation Agriculture. 2013 The Year of Soil Health for the USDA- NRCS (Natural Resources Conservation Service).

E N D
Kerry ClarkBradford Research CenterDepartment of Soil, Environmental and Atmospheric ScienceUniversity of Missouri Soil Quality/Health Assessment and Management in Conservation Agriculture
2013 The Year of Soil Health for the USDA- NRCS (Natural Resources Conservation Service) http://www.swcs.org/en/publications/beyond_t/ http://www.nrcs.usda.gov/wps/portal/nrcs/main/national/soils/health/
SOIL QUALITY DEFINITION Soil quality is the capacity of a specific kind of soil to function within natural or managed ecosystem boundaries, to sustain plant and animal productivity, maintain or enhance water and air quality, and support human health and habitation. (Karlen et al., 1997)
Soil quality deals with both inherent and dynamic soil features. • Inherent soil quality relates to the natural characteristics of the soil, such as its texture. These qualities are the result of soil-forming factors and cannot be changed easily. • Dynamic soil quality components -- such as organic matter, soil structure, infiltration rate, bulk density, and water and nutrient holding capacity -- are readily affected by management practices. The dynamic component is of most interest to growers because good management allows the soil to come to its full potential. • Inherent and dynamic soil quality components interact with each other. Some soil types are much more susceptible to degradation and unforgiving of poor management than others. http://soilquality.org/basics/inherent_dynamic.html
Does Soil Quality = Soil Health ????? In USA, SSSA Ad Hoc Committee on Soil Quality recommended a separation between the two terms, with soil quality being a more analytical and quantitative term (Karlen et al., 1997) Terms are now used interchangeably in both scientific literature and the media. Soil health generally refers to the condition of a soil as a result of management while soil quality refers to both the condition of the soil and its inherent properties.
Soil quality has three main components • Sustained biological productivity • Environmental quality • Plant and animal health
Soil quality is the integration of biological with chemical and physical measures of soil quality that affect farmers' profits and the environment. This definition reflects the living and dynamic nature of soil
Why Soil Quality is Important • Soil degradation is a major world-wide problem • The vast majority of agricultural land in the US already has depleted levels of SOM • Poor soil health can lead to reduced yields and reduced profits • Nutrients are lost through leaching and soil erosion in degraded soil • Healthy soil absorbs and holds water better than degraded soil
http://wepp.mesonet.agron.iastate.edu/index.phtml?dstr=02%2F28%2F2013http://wepp.mesonet.agron.iastate.edu/index.phtml?dstr=02%2F28%2F2013
Erosion continues to be a major part of soil degradation. In specialty crop production, plastic mulch is often used for weed control and to warm soil and preserve moisture Rice et al. (2001) found that 2 to 4 times more water and 3 times more sediment is lost in fields with plastic mulch compared to fields that use hairy vetch mulch.
What is the Problem with Tillage? • Causes increased susceptibility to water and wind erosion • Can compact soil below the depth of tillage • Accelerates decomposition of soil organic matter and release of C02 • Damages fungal hyphae and earthworms • Increases net nitrate production and leaching • Can destroy macropores and lead to surface crusting, decreased water infiltration
Why Till? • Improve seed/soil contact • Aeration • Weed suppression • Residue management • Incorporation of fertilizers, manure, etc.
Small changes in SOC resulting from changes in management practices can have large effects on soil behavior and microbial processes.
Conservation Tillage • Leaves surface mulch, which creates microclimates, which stabilizes soil temperature and increases moisture retention • Non-mobile nutrients will accrue in soil surface layer • Reduced erosion • Reduced crusting and better water infiltration
Why Assess Soil Quality • Awareness and education • Evaluation of practice effects and trouble-shooting • Evaluation of alternative practices • Assessment as a monitoring tool • Assessment as an adaptive management tool
Soil quality assessments require measuring the current state of an indicator and comparing the results to known or desired values (Karlen et al., 1997)
Types of Soil Quality Assessment Tools • Qualitative Scorecards – Farmer driven with NRCS http://soils.usda.gov/sqi/assessment/files/MD_card.pdf
Types of Soil Quality Assessment Tools • Qualitative Scorecards – Farmer driven with NRCS • Field Test Kits – NRCS or commercially available
Types of Soil Quality Assessment Tools • Qualitative Scorecards – Farmer driven with NRCS • Field Test Kits – NRCS or commercially available • Lab-based assessments • Soil Management Assessment Framework • Cornell Soil Health Assessment
University of Missouri • Soil Health Lab • Active Carbon • pH • Aggregate Stability • Available P • Mineralizable N • PLFA • Total Carbon • Infiltration • SMAF SQI http://engineering.missouri.edu/soil/soil-health-lab/
Types of Soil Quality Assessment Tools • Qualitative Scorecards – Farmer driven with NRCS • Field Test Kits – NRCS or commercially available • Lab-based assessments • Soil Management Assessment Framework • Cornell Soil Health Assessment • Practice Predictors - use research outcomes to predict the effects of management practices on soil quality. • NRCS Soil and Water Eligibility Tool (SWET) • Conservation Measurement Tool (CMT) • Landscape-level assessments - use satellite and remote sensing technology to assess resource quality at large spatial scales.
Soil Organic Matter • Comprises only a tiny fraction of total mass of most soils (<3% in MO) • Exerts a dominant influence on may soil chemical, physical and biological properties • Much of water holding capacity of surface soils • Majority of cation exchange capacity of surface soil • Formation and stabilization of soil aggregates • Contains large amounts of plant nutrients • Slow release nutrient storehouse • Supplies energy for soil microorganisms • Contains compounds with growth stimulating effects on plants Brady and Weil, 2002
Soil organic matter and its major constituent, organic carbon, can be depleted from soil during tillage Effect of 10 years of conventional till and no-till on OC (calculated from SOM data in Edwards et al., 1999). Soil profile organic carbon concentration under plow till, chisel till, no till, pasture and forest. Puget and Lal, 2005 http://soilquality.org/indicators/total_organic_carbon.html
Soil organic carbon (SOC), which makes up about half of soil organic matter, can be divided into active, slow and passive soil carbon pools Active Carbon Active carbon fuels the soil food web and includes microbial biomass, particulate organic matter, soil carbohydrates and rapidly mineralizable carbon. The active carbon pool can be measured and used as an indicator of differences in management.
Potassium Permanganate Test KMnO4 oxidizes active carbon. The purple color of the chemical changes to pink the more active carbon there is in a soil sample. Results are read in a spectrometer in lab or field or from a color card
Phospholipid Fatty Acid Analysis • Phospholipids are essential membrane components of all living cells • Viable microbes have an intact membrane which contains fatty acids as components of its phospholipids • PLFA analysis is done through a chemical extraction process and analyzed on a gas chromatograph • Phospholipids make up a relatively constant proportion of the biomass of organisms • Rapid changes in microbial community structure can be detected by changes in PLFA patterns
Soil Structure • Arrangement of soil solids and voids • Soil structure influences water infiltration and retention, erosion, crusting, nutrient recycling, root infiltration and crop yield • Expressed as degree of aggregate stability • Aggregation is controlled by SOC, microorganisms, ionic bridging, clay http://ecomerge.blogspot.com/2010/05/what-soil-aggregates-are-and-how-its.html http://vro.dpi.vic.gov.au/dpi/vro/vrosite.nsf/pages/soilhealth_soil_structure
Wright, et al., 1999 Aggregate Stability Fungal-produced glomalin helps bind aggregates Measured with wet sieving http://ed.fnal.gov/trc_new/pandp/soil_research/soil_aggregates.html
Tillage reduces aggregate stability and sizes Chen et al., 2000
Water Infiltration Good infiltration allows for less runoff and erosion Soils with poor aggregate stability will crust, damaging emerging seedlings and increasing runoff
Improving Soil Quality • Reduce or eliminate tillage. Tillage causes soil organic carbon loss, affects microbial biomass, depletes the soil nutrient pool and damages soil structure • Crop rotation • Don’t leave ground bare • Maintain lots of plant residue • Add organic matter, such as manure and compost • Plant cover crops
Manure and Compost • Improve water infiltration and retention • Improve structure • Add nutrients Water content after 3 years of compost addition Porosity after 4 years of fertilizer, compost or manure addition Zebarth et al., 1999 Celik et al., 2004
cover crops • Provide food for beneficial soil microbes and earthworms • Increase soil organic matter, which helps improve soil quality and fertility Blanco-Canqui et al., 2011
Cover crops prevent runoff and can help retain soil moisture Soil moisture in cover crop and no cover crop plants on May 16, 2012 (one day before corn planted) Field capacity is approximately 34% and the wilting point is approximately 18 % soil moisture.
Soil Moisture Retention By Cover Crops In Corn DAR= days after rain (irrigation)
Soil Moisture Retention By Cover Crops In Soybean DAR= days after rain (irrigation)
Cover crops help reduce soil compaction and soil erosion Blanco-Canqui et al., 2011 Williams and Weil, 2004
Weed Control • Cover crops produce a lot of biomass, which helps to prevent weed germination and growth • Fallow fields grow weeds, plant a cover crop in the off season Cowpea Weedy plot with no cover crop
Nutrient advantages • Winter cover crops capture and hold nitrogen so that it is not lost to the atmosphere • Increased organic matter is a nutrient reservoir • Legume cover crops produce nitrogen that can then be used by the following crop, reducing fertilizer costs McVay et al., 1989
how much does it cost? • Hairy Vetch-$2.0/lb or $60/acre • Austrian Winter Pea-$0.73/lb or $51/acre • Crimson Clover-$1.2/lb or $24/acre • Sunn Hemp-$2.5/lb or $50/acre • Sesbania-$2.4/lb or $84/acre • Cowpea- $1.03/lb or $62/acre • Radish-$4 lb or $32/acre • Cereal Rye-$0.23 lb or $21/acre • Annual Rye-$0.80 lb or $16/acre
How much does it save?Cost of Nitrogen per Pound Ammonium Nitrate is $0.72/lb, you save by planting cover crops • Hairy Vetch-$60@ 100 lb N/acre=$0.60/lb • Austrian Winter Pea-$51@80 lb N/acre=$0.63/lb • Crimson Clover-$24@75 lb N/acre= =$0.21/lb • Sunn Hemp-$50@120 lb N/acre= =$0.42/lb • Sesbania-$84@120 lb N/acre= =$0.70/lb • Cowpea- $62@100 lb N/acre= =$0.62/lb
Many studies have shown increased vegetable yields under conservation tillage with cover crops Similar yields were achieved in tomatoes grown under plastic and with cover crops (Buyer et al., 2010) in Maryland, but soil microbial populations differed significantly under the different treatments Table 2. Tomato marketable yield (Mg/ha)
Similar yields were achieved in tomatoes grown under plastic and with cover crops (Buyer et al., 2010) in Maryland, but soil microbial populations differed significantly under the different treatments Table 3. PLFA concentrations
Kelly et al. (1995) found that a hairy vetch mulch system was more profitable over a three year period than a plastic mulch system in Maryland. They attributed this to higher yields with a lower cost structure and to higher late season prices. Tomatoes grown in plastic matured more quickly but prices were higher late in season when vetch mulch tomatoes matured