Download
1 / 1
10 likes | 105 Vues
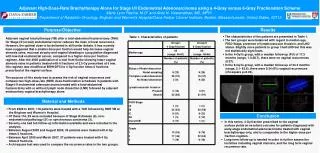
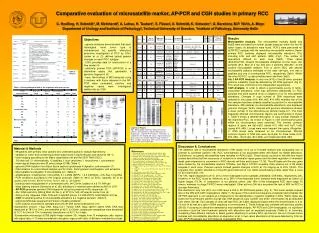
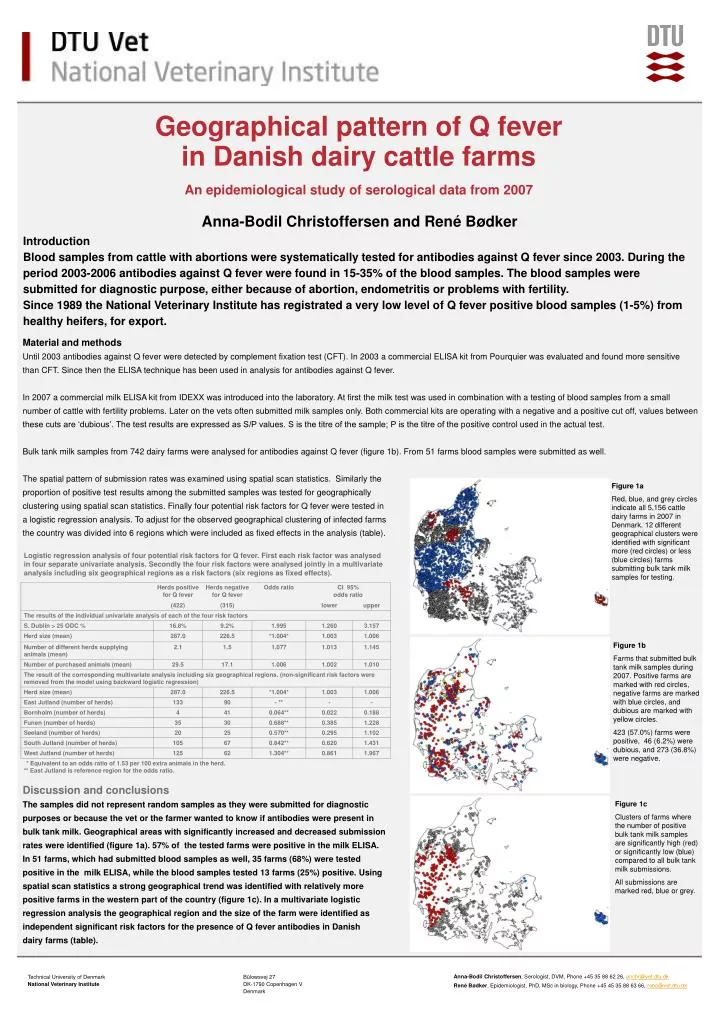
Figure 1a Red, blue, and grey circles indicate all 5,156 cattle dairy farms in 2007 in Denmark. 12 different geographical clusters were identified with significant more (red circles) or less (blue circles) farms submitting bulk tank milk samples for testing. Figure 1b

E N D
Figure 1a Red, blue, and grey circles indicate all 5,156 cattle dairy farms in 2007 in Denmark. 12 different geographical clusters were identified with significant more (red circles) or less (blue circles) farms submitting bulk tank milk samples for testing. Figure 1b Farms that submitted bulk tank milk samples during 2007. Positive farms are marked with red circles, negative farms are marked with blue circles, and dubious are marked with yellow circles. 423 (57.0%) farms were positive, 46 (6.2%) were dubious, and 273 (36.8%) were negative. Geographical pattern of Q feverin Danish dairy cattle farmsAn epidemiological study of serological data from 2007 Anna-Bodil Christoffersen and René Bødker • Introduction • Blood samples from cattle with abortions were systematically tested for antibodies against Q fever since 2003. During the period 2003-2006 antibodies against Q fever were found in 15-35% of the blood samples. The blood samples were submitted for diagnostic purpose, either because of abortion, endometritis or problems with fertility. • Since 1989 the National Veterinary Institute has registrated a very low level of Q fever positive blood samples (1-5%) from healthy heifers, for export. • Material and methods • Until 2003 antibodies against Q fever were detected by complement fixation test (CFT). In 2003 a commercial ELISA kit from Pourquier was evaluated and found more sensitive than CFT. Since then the ELISA technique has been used in analysis for antibodies against Q fever. • In 2007 a commercial milk ELISA kit from IDEXX was introduced into the laboratory. At first the milk test was used in combination with a testing of blood samples from a small number of cattle with fertility problems. Later on the vets often submitted milk samples only. Both commercial kits are operating with a negative and a positive cut off, values between these cuts are ‘dubious’. The test results are expressed as S/P values. S is the titre of the sample; P is the titre of the positive control used in the actual test. • Bulk tank milk samples from 742 dairy farms were analysed for antibodies against Q fever (figure 1b). From 51 farms blood samples were submitted as well. • The spatial pattern of submission rates was examined using spatial scan statistics. Similarly the proportion of positive test results among the submitted samples was tested for geographicallyclustering using spatial scan statistics. Finally four potential risk factors for Q fever were tested ina logistic regression analysis. To adjust for the observed geographical clustering of infected farmsthe country was divided into 6 regions which were included as fixed effects in the analysis (table). • Discussion and conclusions • The samples did not represent random samples as they were submitted for diagnostic purposes or because the vet or the farmer wanted to know if antibodies were present inbulk tank milk. Geographical areas with significantly increased and decreased submissionrates were identified (figure 1a). 57% of the tested farms were positive in the milk ELISA. In 51 farms, which had submitted blood samples as well, 35 farms (68%) were tested positive in the milk ELISA, while the blood samples tested 13 farms (25%) positive. Using spatial scan statistics a strong geographical trend was identified with relatively more positive farms in the western part of the country (figure 1c). In a multivariate logistic regression analysis the geographical region and the size of the farm were identified as independent significant risk factors for the presence of Q fever antibodies in Danish dairy farms (table). Figure 1c Clusters of farms where the number of positive bulk tank milk samples are significantly high (red) or significantly low (blue) compared to all bulk tank milk submissions. All submissions are marked red, blue or grey. Anna-Bodil Christoffersen, Serologist, DVM, Phone +45 35 88 62 26, anchr@vet.dtu.dkRené Bødker, Epidemiologist, PhD, MSc in biology, Phone +45 45 35 88 63 66, rebo@vet.dtu.dk Technical University of Denmark National Veterinary Institute Bülowsvej 27DK-1790 Copenhagen V Denmark