Download
1 / 15
150 likes | 353 Vues
Data logging – Weather forecasting case study. Chapter 14. Weather forecasting –How it used to be done. Traditionally weather forecasting relied upon the use of large numbers of different places in the country sending in regular reports to the government’s Metrological Office.

E N D
Weather forecasting –How it used to be done • Traditionally weather forecasting relied upon the use of large numbers of different places in the country sending in regular reports to the government’s Metrological Office. • These inputs were recorded and collated, and then used to predict the future weather.
Weather data • The weather data that is collected every 24 hours includes: • Wind direction. • Wind strength. • Maximum and minimum temperature. • Relative humidity. • Number of hours of sunshine. • Precipitation (Rainfall/Snow).
The problem • How can data be collected regularly? (i.e. Every hour, on every day, throughout the whole year) • How can human error be avoided?
The answer • Data logging – which can be automated and does not require any human intervention.
Data logging devices • Temperature sensors. • Wind speed sensors. • Wind direction sensors. • Rainfall detectors. • Light detectors. • Humidity sensors.
Temperature sensors • These are heat-sensitive sensors that produce an analogue temperature signal which is converted (via an analogue-to-digital converter) to a digital signal. • This signal is then stored in a microprocessor that is downloaded regularly.
Wind speed sensors • A revolving anemometer (which it spins faster or slower depending upon the speed of the wind) is used to measure wind speed. • An optical sensor counts the number of times the anemometer revolves in a given length of time, and converts the number into a binary digital signal that can be stored and download later.
Wind direction sensors • These use a grey code disk attached to a weather vane. • As the weather vane moves, optical sensors read the disk and generate a three bit binary pattern that can be stored for later downloading.
Rainfall detectors • Rainfall is collected in small buckets which, when full, tilt and empty. • An optical sensor detects each time a bucket tips, and saves the number of ‘tips’ as a digital number that can be downloaded later.
Light detectors • These use a special diode that registers the number of times and the length of time the sun shines during a given length of time. • This analogue information is converted into digital signal that can be stored and later downloaded.
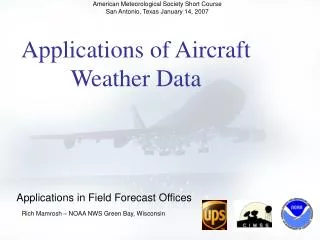
Other inputs that can be used • Weather satellite images – optical and radar ‘pictures’ of weather fronts as they develop. • Weather satellite sensors – measure atmosphere and ground temperatures as well as the movement of cloud systems. • Weather balloon carrying sensors.