Download
1 / 21
210 likes | 284 Vues
The brown shrimp population on our continental shelf and within our bays and estuaries has been the basis for a major Texas maritime industry for decades.

E N D
The brown shrimp population on our continental shelf and within our bays and estuaries has been the basis for a major Texas maritime industry for decades. Use this powerpoint to become acquainted with the population’s lifecycle and how physical aspects of the environment can affect the success of it’s annual regeneration. Love that scampi …… Bon appetit ……
Gulf of Mexico - Penaeus AztecusThe Brown Shrimp FisherySpring Recruitment
The brown shrimp population is preyed upon by Gulf (to the left) as well as Bay (upper right) fishermen. Some of the larger Gulf boats can refrigerate and a few even freeze their catch on board.
catch .. and bycatch The presence of “bycatch” in every net tow for brown shrimp is an example of the inadvertent yet undeniable waste that can even occur within a well-managed fishery effort. In general, nets intercept what gets in the way and part of what is caught could be either inedible or out of season or wrong size or ruled out-of-bounds by government edict or shouldn’t be removed from the food chain. For sure, the bycatch fish on the deck above are dead or soon will be and will eventually be overboard for scavengers.
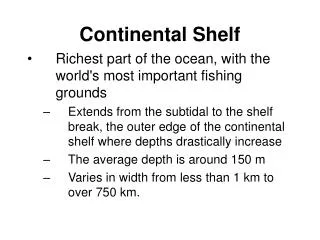
Between adult and just-hatched life stages, brown shrimp spawn and eggs hatch on the mid-grounds of the continental shelf. The post-larvae move through the entrances to bays and estuaries in the spring, the juveniles mature therein over the summer, and the new adults migrate through the entrances back into the Gulf during late summer and early fall to join older adults and start the cycle again.
The brown shrimp’s cyclic life behavior from shelf to estuary and return is an annual occurrence that takes place all along the Gulf Coast. Note that the surface current drift vectors give mean values for a nine month interval during the year. As in the case of the Alaskan Pollock fishery, deviations from the mean are quite important to year class success in the recruitment phase. In fact, turbulence in the form of eddies can play a major role along the Texas coast.
recruitment Each new year class represents renewal for any given species, a major factor in the assessments of a fishery’s population, that is, its annual biological productivity. This must serve as part of the input for a regulating agency’s calculations of a year’s commercial catch quota. When possible, to assure accurate model input, recruitment is accomplished at an early life stage that minimizes the effects of depredation, and is carried out in a confined geographic location over a short time interval when there is limited ability to evade trawl nets. Penaeus Aztecus admirably meets all these criteria : after hatching at mid-shelf, the larvae migrate and aggregate on the bottom adjacent to Gulf of Mexico bay and estuary entrances in late March and early April. At the next strong, tidal flood stage, the larvae rise into the water column and pass through the entrances where they establish a foot-hold on muddy substrate bottoms, preferably within sea-grass-bed protection. During this migration, fishery scientists use towed, standard net systems for givrn time intervals in the entrances to catch larvae and count their numbers. The results are deemed each bay and estuary’s recruitment for the year class.
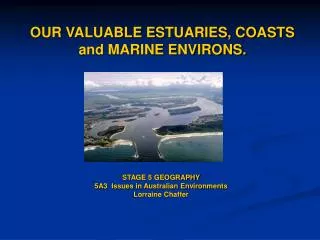
In the early spring, brown shrimp migrate from the mid-grounds to gather before the bay entrances. Prominent in this realization are aggregations forming from Lake Charles (on the right) to Aransas (to the left). The appropriate Spring tide that carries them into the bays occurs during the two week interval from the last week of March thru the first week of April. Sampling in the entrances during this time yields recruitment values.
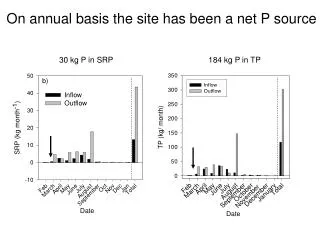
These are relative net tow counts for brown shrimp post-larvae at Galveston Entrance gathered over a 63-73 decade. The graphs reveal that another second recruitment peak can occur in the fall season. Not necessarily any minor after-thought, a fall recruitment can be significantly larger than that in the spring. As well, this variability might not easily be explained in terms of biological processes alone. There are several physical processes that can contribute as underlying causes of these differences.
We can gain some insight into the effect of physical processes on brown shrimp recruitment using satellite imagery and field observations. Note that the following images are generated by sensors aloft that detect infrared radiation produced by the earth and ocean; what we call terrestial radiation. The image patterns exhibited on the ocean’s surface mimic its temperature distribution albeit slightly altered through absorption and re-radiation by atmospheric water vapor. As well, pattern shifts from satellite pass to satellite pass have been successfully related to ocean surface motion. Take a peek at the next slide and come back. When spring flooding advances southward along the Mississippi River, its waters reach the Gulf of Mexico through the river-mouth delta and through Atchafalaya Bay. The latter course is by virtue of a weir [a submersible barrier] along the river that can go underwater and allow part of the flood to run south to Atchafalaya Bay rather than continue toward New Orleans and then to the Gulf. These diverted cold waters exit the Bay and form a current that moves westward at mid-shelf, following the coastal curvature, and so southwestward along Texas’ coast [blue shading]. The image clearly shows this current stripping blobs of Bay water [green shading] that are generated by ebb tide outflows through Galveston Entrance. These blobs can intercept and capture larvae attempting to enter and transport them southwestward in the offshore current along the Texas coast. Thus they have possibilities to enter other estuaries and survive to adulthood [perhaps, thru Aransas Entrance into Corpus Christi Bay]. As in Alaska, we have busses [eddies] to move larvae to possible safety and, as well, unfortunately, concentrate them within and bring on predators.
Missisippi River waters (blue) flowing west from Atchafalaya Bay, entraining Galveston Bay eddies (green), and then progressing southwestward along the Texas coast
In Texas springtime, there are numerous advances of atmospheric fronts generally southward from the US midsection across our coastline. Some of these will force water from Lake Charles, Sabine and Galveston out into the Gulf. The infrared signature is that of colder water plumes extending outward into slightly warmer water. The plumes are entrained in and advected by local alongshore currents. To differing extents, such plumes can be induced at any bay location by wind action, sustained over several days, associated with a frontal approach and passage from land to sea, when it comes from the right direction. These plumes can further result in eddies that provide a transient circular, closed motion in the vicinity of a bay or estuary mouth. At Galveston, the right direction is from the north. A plume was generated over March 31 through April 1, ‘87. The image shown is the first of two that were taken approximately 12 hours apart by a NOAA satellite. Temperature pattern shifts between the two were used to obtain the associated surface flow pattern that shows the plume development. And, over another 12- hour interval, images on April 2-3 show a clockwise eddy flow pattern adjacent to Galveston Island. For eddy : herein remember bus, much like those that give sanctuary to Pollock larvae off the Alaskan Peninsula. You can expect the same sort of two-sided sword; safety and danger, motion that can get post-larval shrimp to safety in a nearby bay as well as set up a dangerous concentration attracting predators.
This flow field was extracted from two infrared satellite images obtained by a NOAA satellite on March 31 ‘87. Note that northeastward alongshore surface motion from the southwest corner of the chart is diverted offshore by the emergence of a plume from Galveston Entrance. Similar southeastward flow in plumes extend seaward from Sabine and Lake Charles and continue displace-ment of the alongshore motion.
Above is a flow field extracted from infrared satellite images obtained by a NOAA satellite on April 02-03 ’87. The flow pattern extracted from the images clearly indicates the surface motion of a clockwise eddy off Galveston Island. The eddy is entraining waters off Bolivar Peninsula, from the northeastward alongshore motion seaward of Freeport, San Luis Pass and the Island.
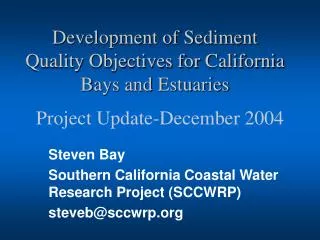
Three graphs provide environmental observations [sea surface temperature, wind speed and direction, and tide gauge sea level taken within Galveston Bay at Fort Point, the US Weather Bureau, and Pier 21 respectively over several days that include satellite passes, a frontal passage and a spring tide. The images and their times are indicated by two vertical lines. The F marks the time assigned to a flow field extracted from two images. The temperature trace shows a steady drop [18 to 12 degrees Celcius] over March 29-30 as the overall Bay level lowered and colder, previously land-held waters drained seaward. This motion occured in response to consistent winds from the north that mark the approach and passage of a strong atmospheric front. The wind graph is known as a stick plot wherein the length of the stick indicates wind speed and its orientation relative to “up” on the page [north] gives the direction from which the wind blows. The front passed seaward over the bay on March 31. During the interval, the plume feature in the March 31 satellite image was generated off Galveston Entrance. The sea level graph indicates an initial drop in water level that correlates well with the surface water temperature decrease and the winds from the north and a return to a more natural level after the front’s passage. Notice that another similar wind event on April 02-03 was not as strong as the first nor as sustained. Outflow from the Galveston Bay complex did not accompany this forcing.
Environmental observations in the Galveston area that overlap the satellite images, 1 and 2.
The peak in recruitment of post larval brown shrimp through Galveston En-trance was reached on April 01 and 02 as was the maximum tidal height and the flood tide current. This recruitment data was gathered by Galveston National Marine Fisheries personnel that decided not to work on the 28th and 29th. Note that the ordinate is a log10 scale.
ANOTHER FRONTAL PASSAGE THAT PRODUCED PLUMES; during another year