Download
1 / 40
400 likes | 572 Vues
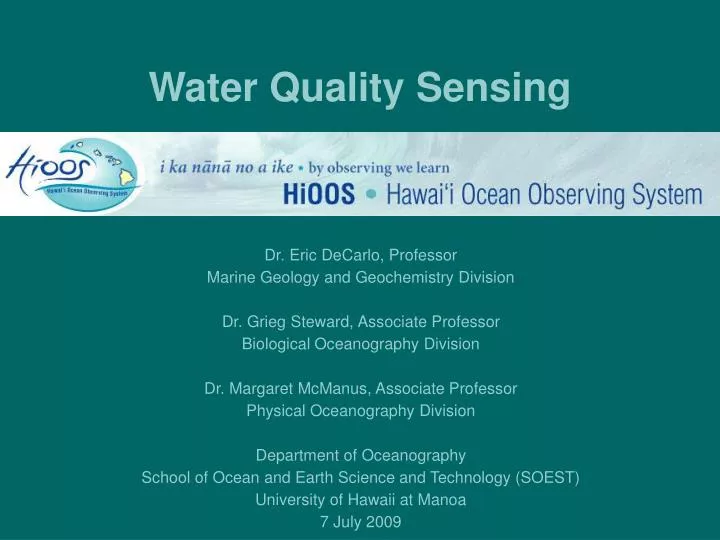
Water Quality Sensing. Dr. Eric DeCarlo, Professor Marine Geology and Geochemistry Division Dr. Grieg Steward, Associate Professor Biological Oceanography Division Dr. Margaret McManus, Associate Professor Physical Oceanography Division Department of Oceanography

E N D
Water Quality Sensing Dr. Eric DeCarlo, Professor Marine Geology and Geochemistry Division Dr. Grieg Steward, Associate Professor Biological Oceanography Division Dr. Margaret McManus, Associate Professor Physical Oceanography Division Department of Oceanography School of Ocean and Earth Science and Technology (SOEST) University of Hawaii at Manoa 7 July 2009
Water Quality Sensing The economic well-being of the State of Hawaii depends upon healthy coastal ecosystems. Public confidence in water quality and safety is crucial. Many current monitoring approaches are labor intensive and slow. Our integrated coastal sensor/ocean observing system will: Boost public confidence by emphasizing the usually high quality of Hawaii’s coastal waters. Contribute to public safety by providing early warning of water quality problems and forecasting areas likely to be affected.
Water Quality Sensor Locations NS-03 NS-04 University of Hawaii at Manoa Moana Surfrider
Outline Near Shore Water Quality Sensors Water Quality Buoys Pathogen Sampling The Future
Data Flow Diagram Data Flow Diagram
Data Flow Diagram Data Flow Diagram
Early Warning System Alert • Matlab code on SOEST server • Automatic, hourly threshold checks • NS01, NS02 – salinity and temperature • USGS – rainfall, stream height, stream flow • If threshold is exceeded, the program sends text message to • Members of the Ala Wai Research Group • cell phone or emails (depending on choice) • Triggers sampling alert • Other hourly checks (sends alerts if web sites are down)
Early Warning System Alert Title: EVENT ALERT Body: Manoa rainfall is currently 0.6ft.” or “NSO1 Salinity is 15 PSU.” If multiple thresholds are exceeded, the message adjusts to include all of the values, i.e. “Manoa rainfall is currently 0.6ft, NS01 Salinity is 15 PSU and NS02 Salinity is 18 PSU.”
What about Pathogens? • Current sensors great for monitoring chemical and physical properties of the water • A major issue for coastal recreational water users is the presence of pathogenic bacteria and viruses
Pathogens The Dream Temp. (°C) Salinity Chlorophyll Turbidity
The Reality • No off-the-shelf sensors yet available for pathogen detection in seawater • Conventional methods are labor-intensive, slow
Cultivation-Based Assays Labor-intensive Hours to days
Molecular & Direct Detection Methods • Molecular - extract DNA, use tools to detect specific genes of interest • Direct Detection - Capture pathogenic viruses or bacteria on a sensor surface
Molecular MethodsLab in a can & Lab on a chip Expensive, complicated High maintenance Environmental Sample Processor (MBARI)
Direct Capture Pathogens Specific Antibodies
Sensing the Capture Surface Plasmon Resonance Quartz Crystal Microbalance http://www.biosensors.pan.olsztyn.pl/images/stories/reserearchprofile/qcm-2.jpg http://spie.org/Images/Graphics/Newsroom/Imported/0882/0882_fig1.jpg
The Challenges for Automation • Biofouling • What are we looking for? Too many potential pathogens to screen for all of them • The needle in a haystack
Biofouling www.d-a-instruments.com/images/
What are we looking for? • Sewage Pathogens • There are many possible pathogens, usually present at low levels • Indicator organisms, not pathogenic, but more abundant and come from the same source (e.g., enterococci as indicators of sewage) • Non-sewage pathogens: some pathogens are not pollutants
Sewage IndicatorWater quality vs. Rainfall Exceedance data calculated from Dept of Health, Clean Water Branch web site
EnterococciNot a Reliable Indicator Data from Dept of Health, Clean Water Branch
The Needle in the Haystack • Pathogens are a tiny fraction of the microbes in seawater • Outnumbered by “good” microbes by a millions or billions to one
The Future (for Pathogens) • Pathogen sensors are under development, but there are hurdles to routine deployment • In the meantime, the abundance of non-sewage pathogens, like vibrios, may be predictable using data from existing sensors and predictive models.
The Future (Automated Water Quality Sensors) • You could also go into our plans for water quality deployments in the Pacific region and illustrate the potential linkage to the instruments Rusty has out with CRED • CRED is backbone of ecological • Part of IOOS future Installation of water quality monitoring systems in each of the PacIOOS jurisdictions.
The Future Partnership: Coral Reef Ecosystem Division • You could also go into our plans for water quality deployments in the Pacific region and illustrate the potential linkage to the instruments Rusty has out with CRED • CRED is backbone of ecological • Part of IOOS future CRED study areas: Ecosystem Observations ~50 islands & atolls
March of 2006 375,000 gallons of raw sewage were diverted into the Ala Wai canal when a sewer main in Honolulu cracked after several days of heavy rain. Several people who came into contact with the contaminated water became ill, and there have been suggestions that one death resulted from the incident. For several weeks after the incident, it was unclear (1) if there were harmful bacteria in our nearshore waters as a result of the diversion, (2) if the nearshore circulation patterns were retaining Ala Wai waters nearshore. Without an idea of the baseline biological and physical conditions in the Ala Wai and adjacent coastal waters, it was impossible to determine when and if the system had returned to baseline An Example of the Problem
Ala Wai Research Group • Members include: • Drs. Geno Pawlak and Sergio Jaramillo, Ms Jennifer Patterson (Ocean Resource Engineering UH Manoa) • Drs. Margaret McManus, Eric DeCarlo, and Grieg Steward, Mr. Ross Timmerman, Mr. Mike Tomlinson, and Ms. Olivia Nigro (Oceanography UH Manoa) • Dr. Marc Ericksen and Mr. Andrew Rocheleau (Sea Engineering) • Army Corps of Engineers (CH2M Hill Lisa Kettley) • USGS - invited • Regular Conference calls/workshops 3 times/year • Linked by ALERT system • Coordinated physical and biological sampling