Download
1 / 32
320 likes | 412 Vues
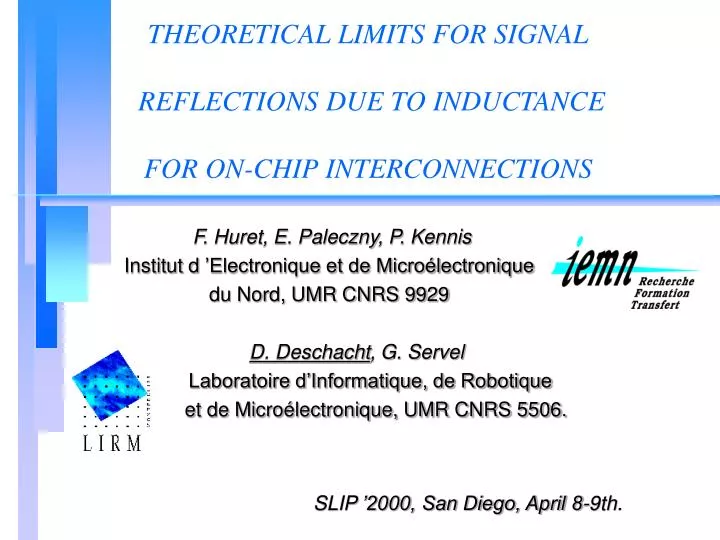
THEORETICAL LIMITS FOR SIGNAL REFLECTIONS DUE TO INDUCTANCE FOR ON-CHIP INTERCONNECTIONS. F. Huret, E. Paleczny, P. Kennis Institut d ’Electronique et de Microélectronique du Nord, UMR CNRS 9929 D. Deschacht , G. Servel Laboratoire d’Informatique, de Robotique

E N D
THEORETICAL LIMITS FOR SIGNAL REFLECTIONS DUE TO INDUCTANCE FOR ON-CHIP INTERCONNECTIONS F. Huret, E. Paleczny, P. Kennis Institut d ’Electronique et de Microélectronique du Nord, UMR CNRS 9929 D. Deschacht, G. Servel Laboratoire d’Informatique, de Robotique et de Microélectronique, UMR CNRS 5506. SLIP ’2000, San Diego, April 8-9th.
OUTLINE OF THE TALK Introduction Theoretical limits Electromagnetic analysis : - Methodology - Application Limits between RLC and RC models Illustration of the theoretical limits : - in frequency-domain - in time domain Comparison with previous work Conclusion
INTRODUCTION 10 years of evolution 1989 1999 • 0.7µm, 2 metal layers • Up to 100,000 devices on a chip • Typical CPU frequency 50MHz • 0.25µm, 6 metal • Up to 10,000,000 devices on a chip • Typical CPU frequency 400 MHz IC
INTRODUCTION With the continued scaling down of technology, increased die aera : * cross-section decreases * interconnect length increases interconnections : blocking point of performances improvement Introduction of new materials such as Cu inclusion of inductance ?
INTRODUCTION Interconnect delay dominates gate delay in current deep submicronic VLSI circuits. More accurate interconnect models and signal propagation characterization are required. With faster on-chip rise times inductance is becoming more important. Electromagnetic analysis is needed.
THEORETICAL LIMITS Short lines : Static hypothesis Long lines : Traveling wave
THEORETICAL LIMITS Range of lengths for inductance inclusion : We have to determine a : attenuation factor b : phase factor x : attenuation coefficient
ELECTROMAGNETIC ANALYSIS Methodology INTERCONNECTION = WAVEGUIDE a Attenuation factor dB/cm ou Np/cm Full wave analysis Finite Element Method b Phase factor rad/cm Zc Characteristic impedance Propagation parameters of the waveguide
ELECTROMAGNETIC ANALYSIS Methodology Definitons of the voltage-current matrices used in this analysis
ELECTROMAGNETIC ANALYSIS Methodology Vout(t) Vin(t) a(freq) b(freq) Zc(freq) + Matched Load Impedances F.F.T. F.F.T.-1 Chain Matrix Vin(freq) Vout(freq) * F.F.T = Fast Fourier Transform
0.8 mm M5 0.8 mm ELECTROMAGNETIC ANALYSIS Application Interconnection geometry and environment passivation passivation 2.4 mm 2.4 mm M5 SiO2 M5 SiO2 7.3 mm 7.3 mm 500 mm Si bulk 7Wcm 1st configuration 2nd configuration 3rd configuration Metal 5 : W=1 mm T= 1 mm Aluminium or Copper
ELECTROMAGNETIC ANALYSIS Application Frequency behavior of the attenuation factors
ELECTROMAGNETIC ANALYSIS Application Frequency behavior of the phase factors
ELECTROMAGNETIC ANALYSIS Application Attenuation determination Traveling wave Attenuation value of the wave, for 10 GHz, versus interconnection length
ELECTROMAGNETIC ANALYSIS Application Theoretical limits : We have determined a, b To determine x : comparison output signal between RC and RLCG models
OUTLINE OF THE TALK Introduction Theoretical limits Electromagnetic analysis : - Methodology - Application Limits between RLC and RC models Illustration of the theoretical limits : - in frequency-domain - in time domain Conclusion
LIMIT BETWEEN RLC AND RC MODELS The RLCG line model deduced from the electromagnetic analysis :
LIMIT BETWEEN RLC AND RC MODELS These calculated values are used to build the distributed p RC model n cells COMPARISON BETWEEN : HSPICE simulations : RC model Electromagnetic analysis : RLC model
LIMIT BETWEEN RLC AND RC MODELS Waveform of input and output signals in the range of lengths with inductance effect
LIMIT BETWEEN RLC AND RC MODELS Waveform of input and output signals in the range of lengths with inductance effect
LIMIT BETWEEN RLC AND RC MODELS Attenuation determination : Limit : the amplitude of the reflected wave is sufficiently low to give the reflection effect negligible
OUTLINE OF THE TALK Theoretical limits : We have determined a, b, x Illustration of the theoretical limits : - in frequency-domain - in time domain
ILLUSTRATION OF THEORETICAL LIMITS in the frequency-domain
ILLUSTRATION OF THEORETICAL LIMITS in the frequency-domain Frequency Time domain
ILLUSTRATION OF THEORETICAL LIMITS in the time-domain
OUTLINE OF THE TALK Introduction Theoretical limits Electromagnetic analysis : - Methodology - Application Limits between RLC and RC models Illustration of the theoretical limits : - in frequency-domain - in time domain Comparison with previous work Conclusion
COMPARISON WITH PREVIOUS WORK « Figures of Merit to characterize the Importance of On-chip Inductance » DAC 98, June 1998 The two figures of merit can be combined into a two sided inequality that determines the range of the length of interconnect in which inductance effects are significant : 1st configuration : R = 17300 W/m C = 170 pF/m L = 490 nH/m G # 0 2nd configuration : R = 17300 W/m C = 63.6 pF/m L = 655 nH/m G # 0
COMPARISON WITH PREVIOUS WORK
COMPARISON WITH PREVIOUS WORK
CONCLUSION A full-wave electromagnetic analysis have been presented to build accurate interconnect models, including inductance effects. New limits for signal reflections due to inductance for on-chip interconnections have been proposed.
CONCLUSION These limits have been illustrated with typical interconnection geometries, for Al and Cu wires. This study shows evidence demonstrating that a range exists for which inductance effects cannot be neglected and requires a transmission line model.
CONCLUSION FUTURE WORK : Interconnect coupling : taking into account not only the coupling capacitance, but also the impact of inductance and mutual inductance.